

THE CLAIM:
Caterpillar just printed the best quarter in its 101 year history. Revenue crossed $20 billion for the first time. The backlog is $72 billion and stretching to 2030. The consensus is calling this a secular re-rating driven by the AI data centre power cycle. We think the market is paying 37x trailing earnings for a business whose normalised earning power is roughly $21 per share, a valuation that implies growth well above anything a cyclical industrial has sustained for a decade. The downside if this cycle peaks is severe. The upside if everything goes right is already in the price.
WHAT THE MARKET BELIEVES:
The bull thesis is simple and quite seductive. AI requires data centres and data centres require power. Caterpillar builds the generators, turbines, and engines that supply that power, plus the construction equipment to build the facilities. The $72.1 billion backlog (up 92% year over year) provides multi-year visibility rarely seen in a cyclical industrial. Power generation sales to end users grew 72% in Q2. Large engine orders run to 2030. The company plans to triple large-engine production capacity by 2030 from 2024 levels. Sell-side targets range from $882 (DA Davidson, Hold) to $1,225 (Truist). Barclays raised to $900 citing “durable earnings power.” The narrative: this is no longer a cyclical name. It is an infrastructure compounder.
WHAT WE FOUND:
Finding 1: Valuation has detached from any plausible normalised earnings. CAT trades at 37x trailing earnings and roughly 30x forward consensus. Its 10 year median P/E is 18.5x (GuruFocus) to 23x (FinanceCharts). The 5 year average is 24.5x. At $855, the market is pricing a permanent structural re-rating of at least 50% above the long-run average multiple, on top of a cyclical earnings peak. Confidence: High.
Finding 2: Cat Financial is a $35 billion+ on-balance-sheet lender funding 233% debt-to-equity. Total consolidated debt hit $44.1 billion at end of 2025 (up 12.9% year over year). Cat Financial alone carries $32.8 billion in finance receivables. Past dues are low at 1.31%, but this portfolio has never been tested against a hard construction downturn while simultaneously scaling to support a data centre buildout of this magnitude. The allowance for credit losses stands at just 0.84% of receivables. Confidence: Medium.
Finding 3: The data centre thesis carries a political fragility the market is underpricing. In Q1 2026 alone, 75 data centre projects worth a combined $130 billion were delayed or blocked by local opposition. Maine enacted a full moratorium in April 2026. Seattle and New York state have moratoriums. Baird downgraded CAT on July 29 specifically citing this backlash. Of CAT’s $72 billion backlog, roughly 41% is scheduled beyond 12 months, meaning substantial execution risk sits outside the near term. Confidence: Medium.
Finding 4: Normalised owner earnings are lower than reported figures suggest. FY2025 adjusted EPS was $19.06, down from $21.90 in FY2024 despite revenue growth, primarily because tariff costs absorbed $1.5 to $1.8 billion. In FY2026, tariff costs are running at $2.2 billion. H1 2026 adjusted EPS of $13.70 annualises to roughly $27+, but this includes a record Q2 ($8.17) that benefited from $392 million in tariff recoveries under the IEEPA and exceptional volume leverage. Stripping tariff recoveries and normalising for cyclical peak volumes, we estimate run-rate owner earnings closer to $21 to $23 per share. Confidence: Medium.
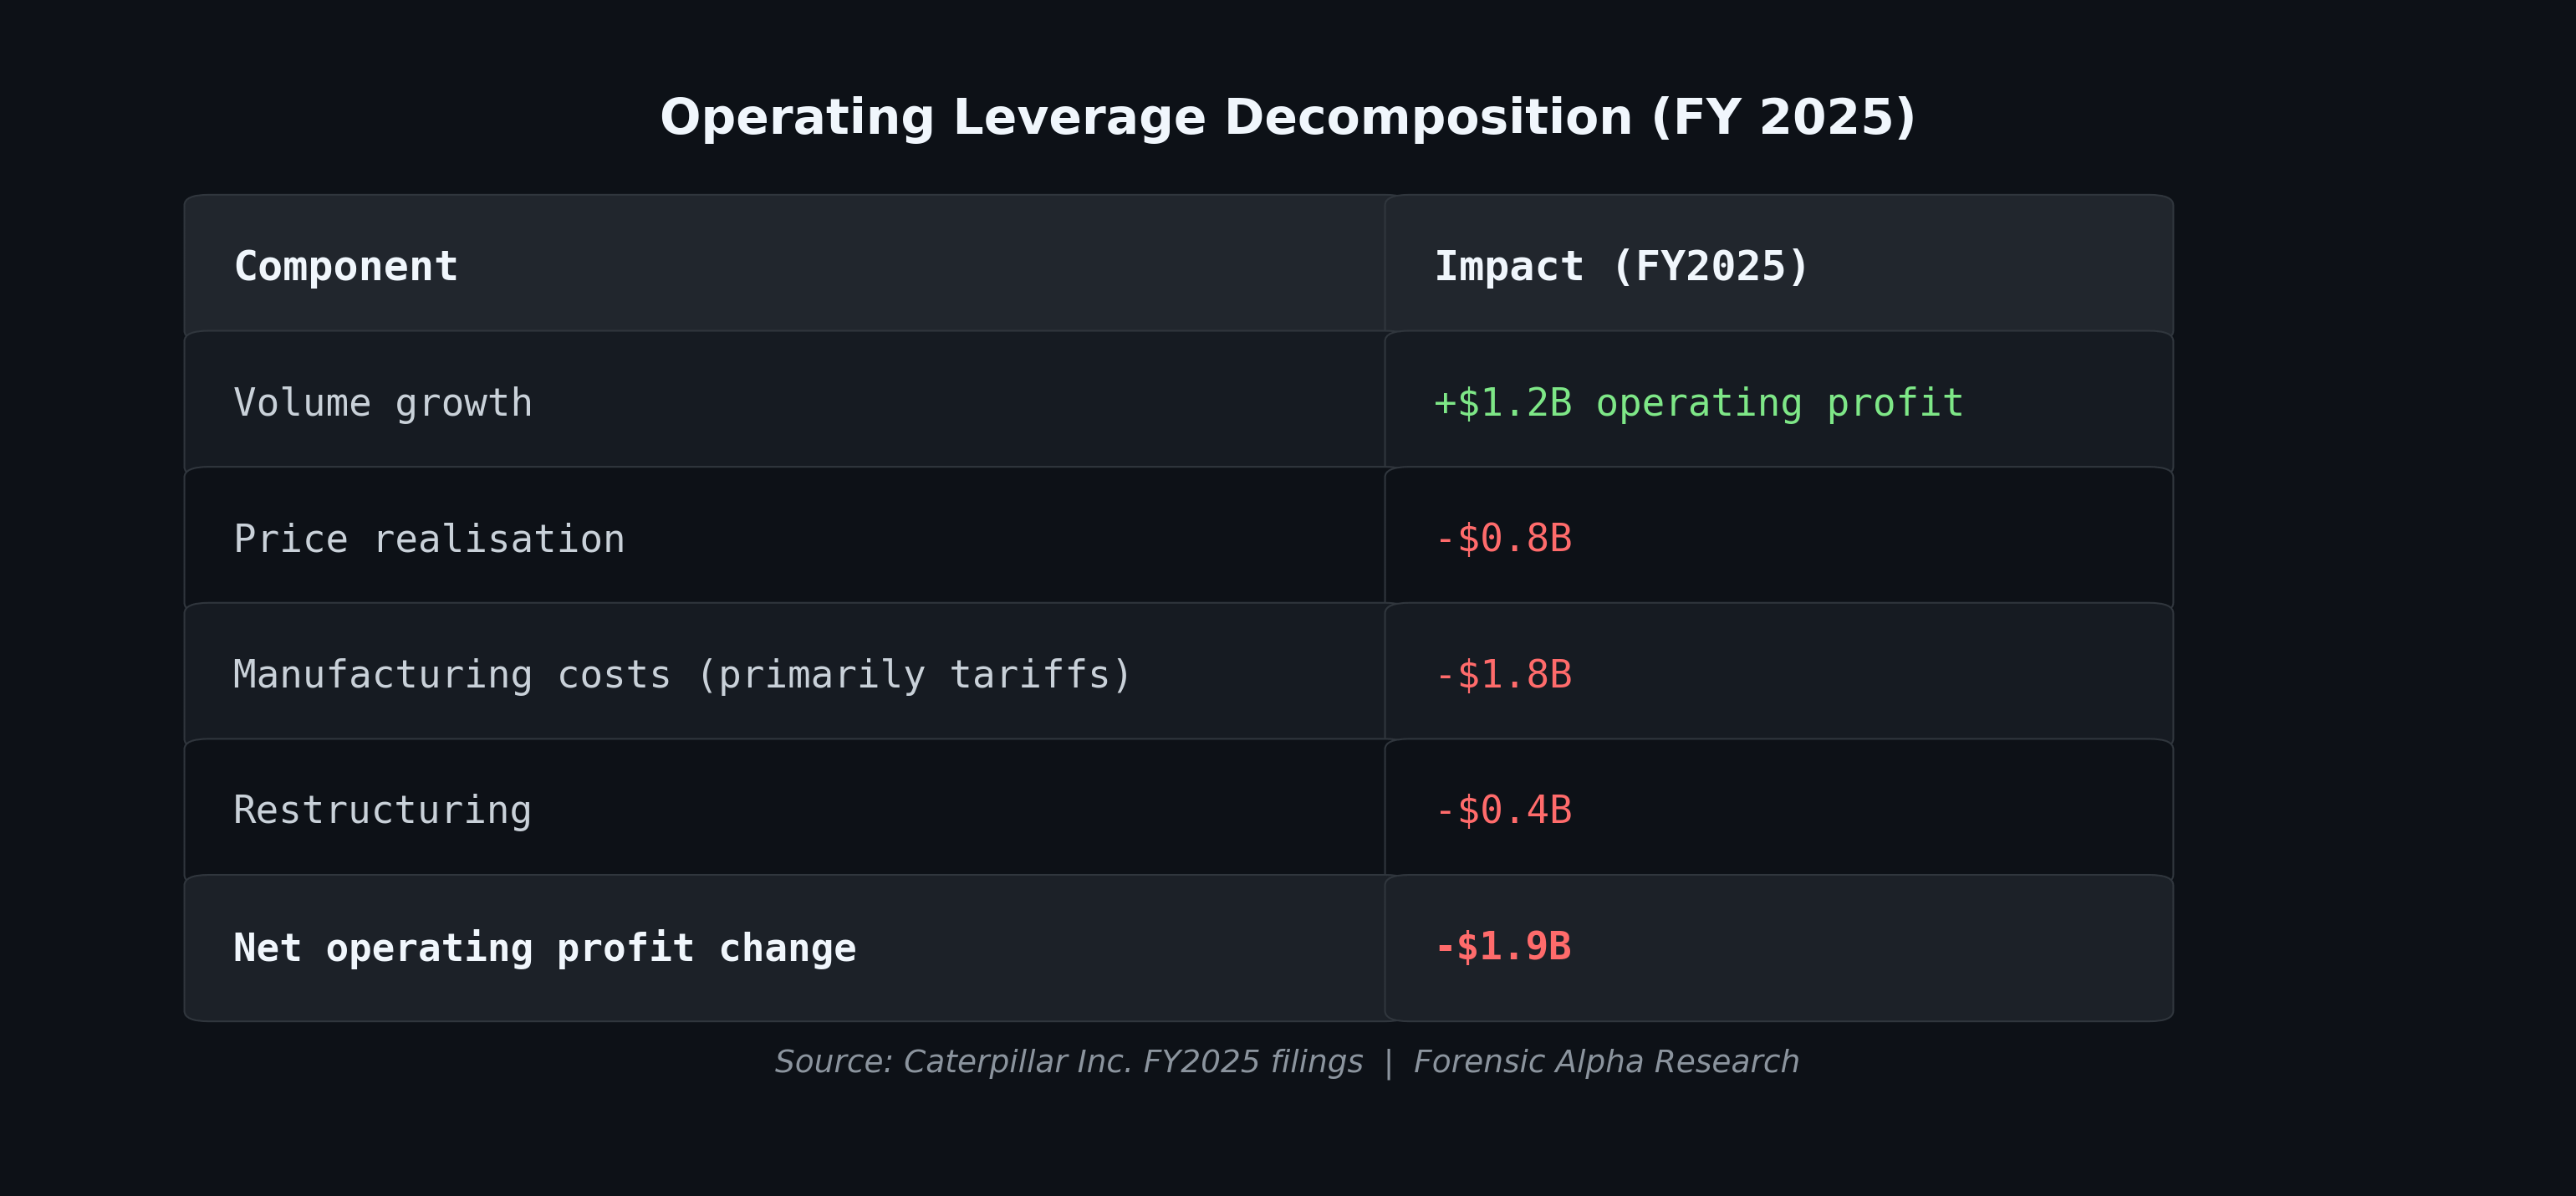
Finding 5: Operating leverage cuts both ways, and the market is pricing only one direction. In FY2025, every incremental dollar of revenue destroyed roughly 69 cents of operating profit as tariff costs ($1.8B) and negative price realisation ($817M) overwhelmed modest volume growth. In Q2 2026, the same operating leverage worked in reverse: revenue grew $3.97B year-over-year and adjusted operating profit expanded by roughly $1.9B, an incremental margin above 45%. The question is not which quarter tells the truth. Both do. The question is which direction the next turn goes, and at 37x trailing earnings the market has already priced the answer. Confidence: High.
THE HEADLINE ASYMMETRY:
At $855, the stock is trading at 37 to 41x our normalised earnings range ($21 to $23). Our base-case intrinsic value sits at $625 per share (probability-weighted: $590). The bear case (recession plus data-centre deceleration) puts fair value at $400 to $450. The bull case (sustained supercycle with permanent re-rating) stretches to $950 to $1,050. Decision: Avoid. The risk-reward is heavily asymmetric to the downside.
Below the wall: the full 14-part forensic teardown. The normalised owner-earnings reconciliation, the reverse DCF with the dominant-variable tornado, the Cat Financial credit analysis, the buyback timing audit, the data-centre moratorium map, the activist unlock plan, the pre-mortem, and the machine-readable summary block.
FULL RED TEAM MEMO: CATERPILLAR INC. ($CAT)
1. FORENSIC RED FLAG SCAN
Beneish M-Score Validity Audit: The M-Score framework is structurally awkward for Caterpillar due to the captive finance subsidiary (Cat Financial) embedded in the consolidated statements. Cat Financial’s $35B+ receivables portfolio distorts the Days Sales in Receivables Index (DSRI) and several other M-Score inputs. We ran a modified version excluding Financial Products. On the ME&T operations alone, receivables growth is broadly in line with revenue growth (revenue +24% Q2 YoY, no outsized receivable divergence flagged). The Gross Margin Index shows improvement (adjusted operating margins rose from 17.6% to 21.9% in Q2), which is not a manipulation signal but a volume-leverage signal in a cyclical upturn. Validity Audit result: 3 of 8 components are distorted by the financial subsidiary. Confidence in any M-Score reading: Low. Score is an artefact of structural complexity, not genuine manipulation evidence.
Sloan Accrual Ratio: Operating cash flow ($11.7B in 2025) significantly exceeds reported net income ($8.9B), yielding a strongly negative accrual ratio. This is a clean signal: cash generation is not lagging reported earnings. No red flag.
Qualitative Filing Quirks (10-Q, Q2 2026):
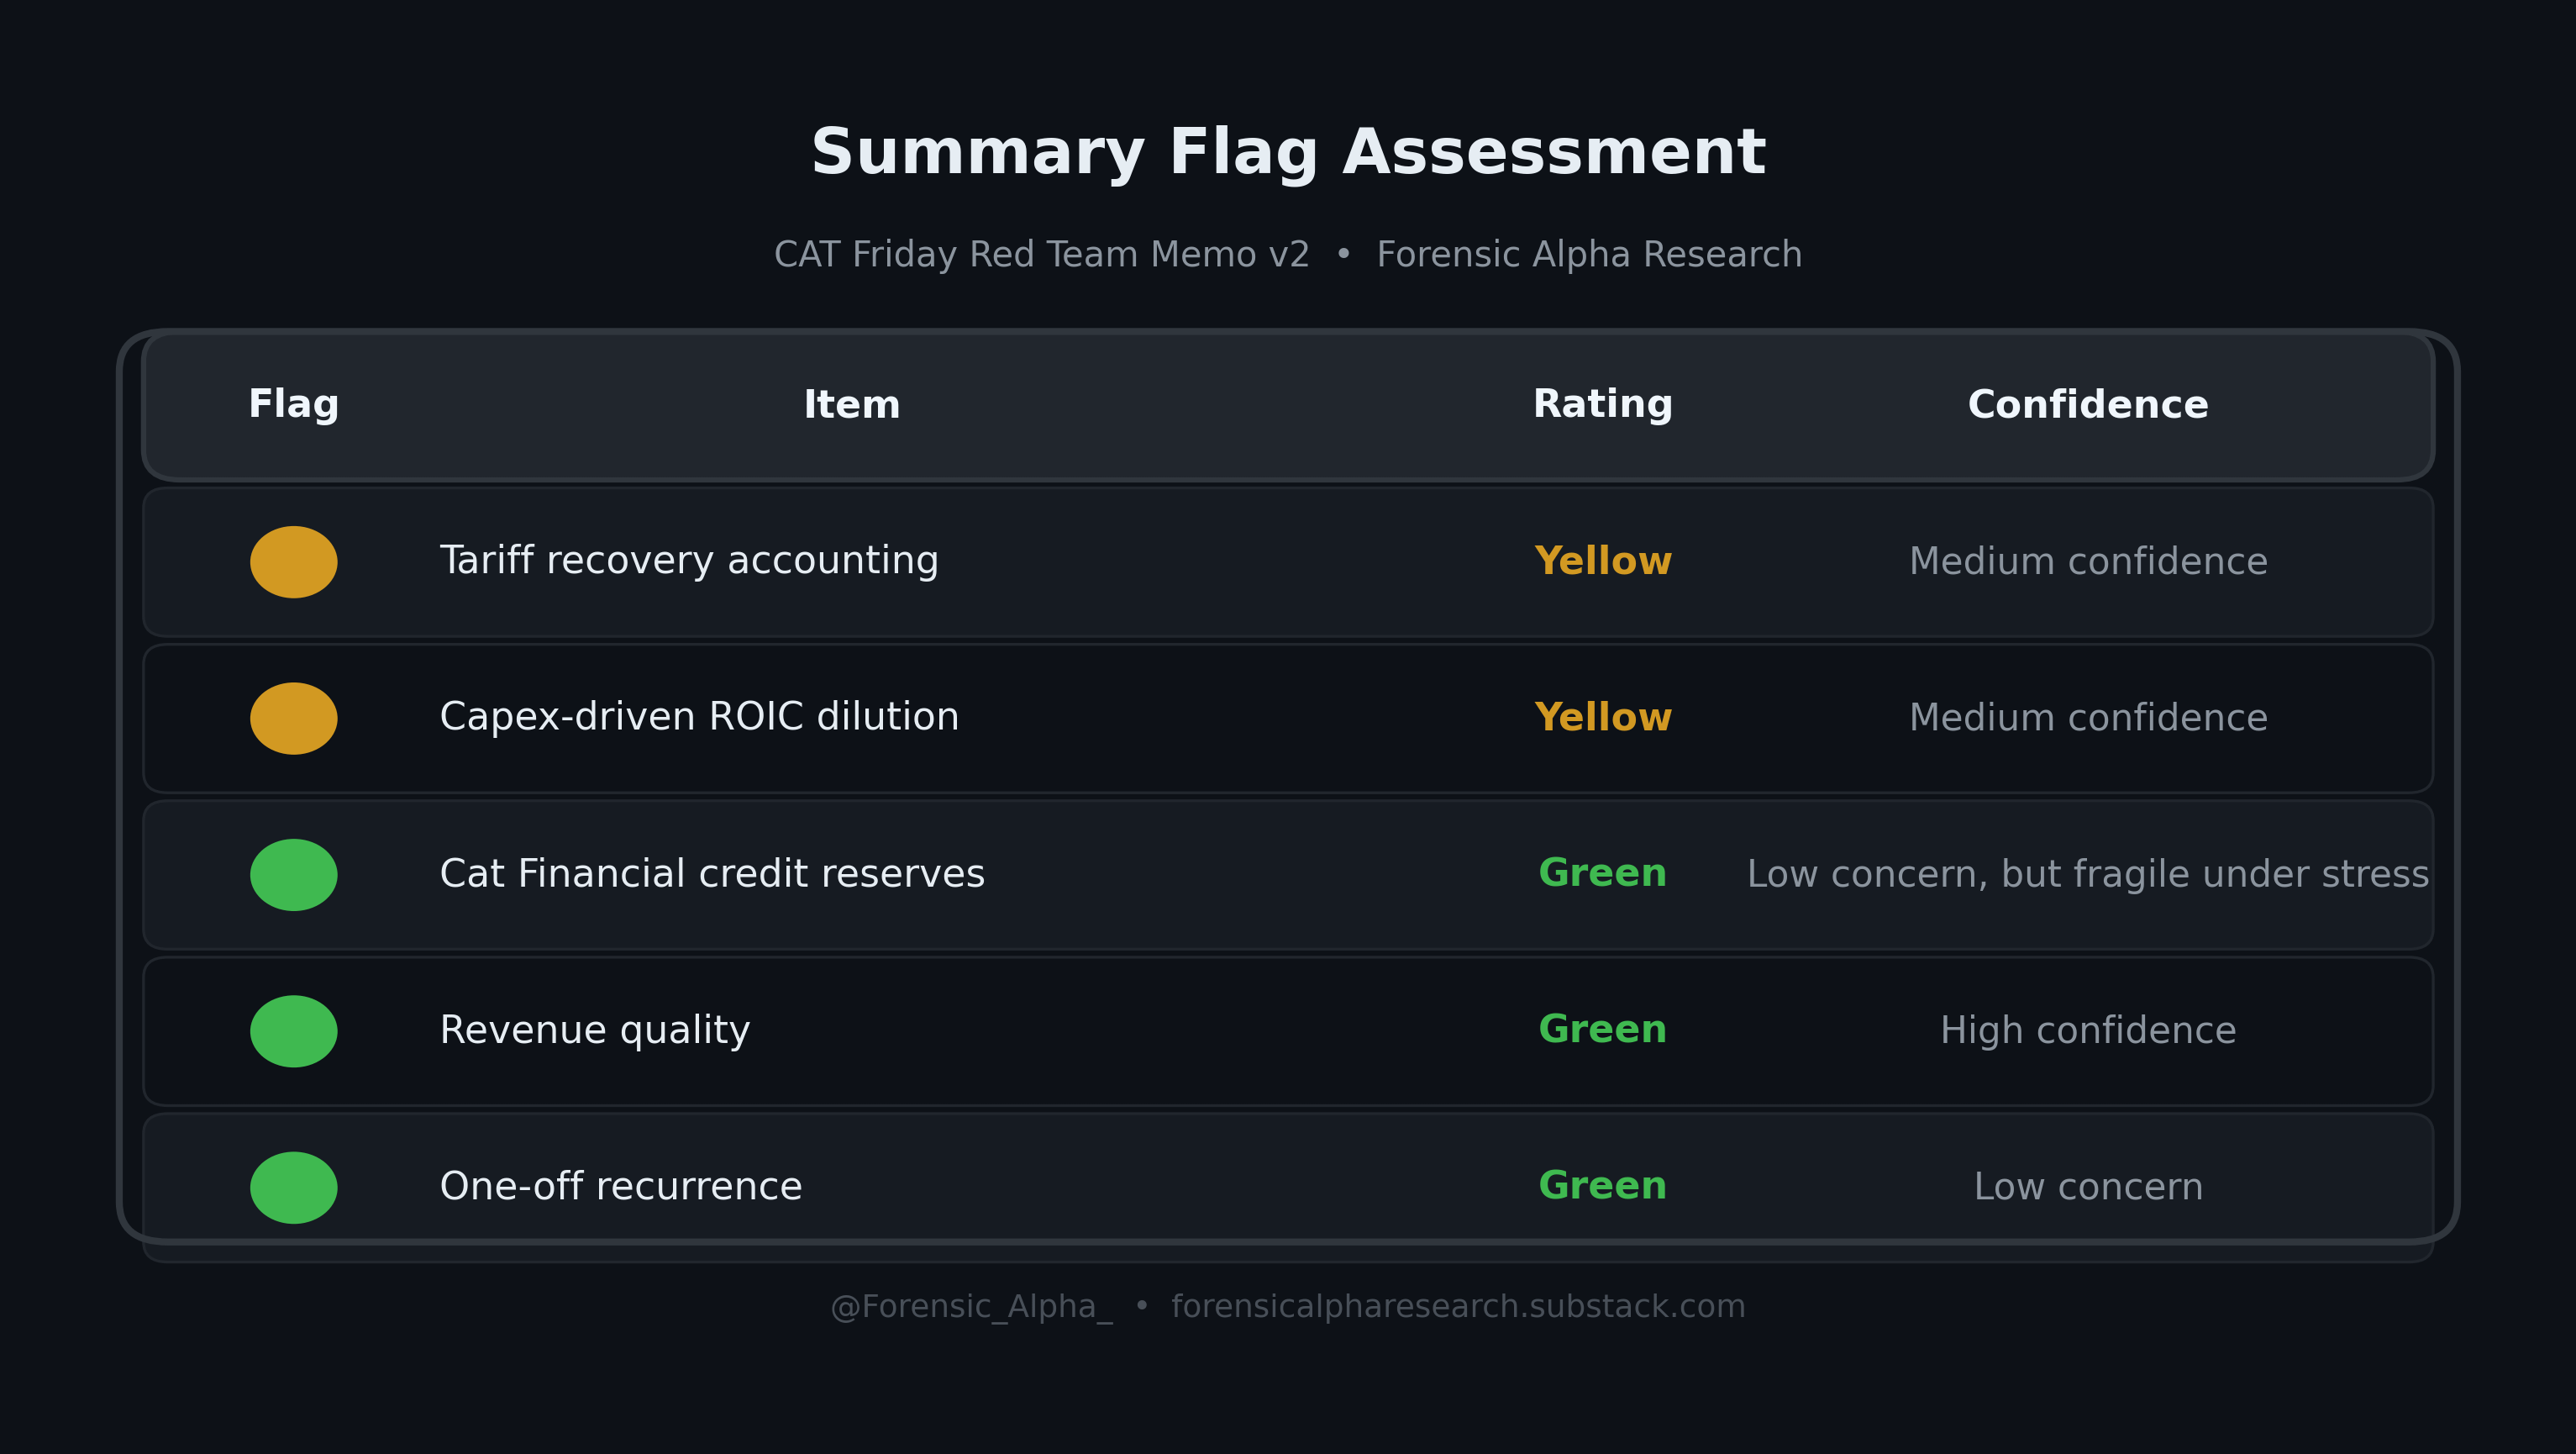
🟡 Tariff accounting opacity. Q2 2026 included $392 million in “expected tariff recoveries” under the IEEPA (International Emergency Economic Powers Act). The company is booking anticipated refunds before receiving them. If trade policy shifts and these recoveries do not materialise, Q2 adjusted EPS of $8.17 drops to roughly $7.50. The market celebrated the $8.17 print. The quality of $0.67 of that figure depends on a political assumption, not an operational one.
🟡 Capex acceleration. Capital expenditure surged to $4.3B in 2025 (up 33% from $3.2B in 2024) as the company invests to triple large-engine capacity. This is not suspicious in isolation, but it inflates invested capital and will suppress ROIC if the revenue ramp disappoints. ROIC already fell from 18.2% (2024) to 14.8% (2025) on this invested-capital expansion.
🟢 Cat Financial credit quality. Past dues fell to 1.31% (from 1.62% a year ago). Net write-offs are negligible at $20M in Q2. The allowance at 0.84% of receivables is thin, but not anomalous given the current credit environment. No red flag today, but this portfolio has not been stress-tested through a combined construction downturn and rate shock simultaneously.
🟢 Revenue recognition. Equipment revenue is recognised at a point in time (shipment/delivery). No channel-stuffing signals: dealer inventories are lean and retail sales to end users are strong (power generation retail sales +72% to users). This is genuine demand, not inventory-push.
🟡 Restructuring charges. $445 million in restructuring charges in FY2025 (divestitures of certain non-US entities). These are real cash costs that adjusted EPS strips out. Over 2023 to 2025, cumulative “adjustments” (restructuring, mark-to-market pension, divestitures) total roughly $850 million. As a percentage of cumulative net income (~$30B), this is under 3%. Below the 5% Valeant/GE threshold, but not trivial.
2. THE BUSINESS AND THE MACHINE
Circle of Competence: Caterpillar manufactures heavy equipment (excavators, bulldozers, loaders, motor graders), power generation equipment (reciprocating engines, gas turbines, generator sets), and mining equipment. It also operates the world’s largest captive equipment finance business (Cat Financial). The dealer network spans 2,700+ locations across 190+ countries.
Simplification/Can it be explained to a 12 Year Old Test: Caterpillar makes the machines that build things and the engines that power things. When governments build roads, companies build data centres, or miners dig for copper, they buy Caterpillar equipment. The company also lends money to customers to help them buy that equipment.
Counter-Paragraph: That simple story is dangerously incomplete because it obscures three dependencies. First, Caterpillar is now a significant financial institution, with $35B+ in loans on its balance sheet, meaning a credit cycle hits the stock from both the equipment side and the lending side simultaneously. Second, the current growth story is heavily concentrated in a single thematic driver (AI data centres) that faces real political headwinds. Third, the cyclicality of the core construction and mining businesses has not been repealed by one super-cycle quarter.
Analytical Edge: Our forensic edge applies directly: capital allocation analysis, buyback timing audits, captive-finance credit forensics, and regime-sensitivity stress testing are the exact tools needed here. Pass.
Missing Data:
• Backlog composition by end market (data centre vs. construction vs. mining vs. oil & gas): not disclosed at the granularity needed to isolate AI exposure. Information Asymmetry Penalty: up to 15% valuation error.
• Cat Financial portfolio-level delinquency breakdown by geography and end market: disclosed only in aggregate. Penalty: up to 10%.
• Dealer inventory levels by segment and geography: partially disclosed. Penalty: up to 5%.
Peter Lynch Story Test (within 100 words): Caterpillar’s earnings double from ~$19 (normalised 2025) to ~$38 over five years through: (1) Data-centre power generation creating a sustained demand floor for large engines, driving Power & Energy to $40B+ annual revenue by 2030; (2) Price realisation of 3 to 4% annually across all segments; (3) Share count reduction from $5 to $7B annual buybacks, retiring 3 to 4% of shares per year; (4) Mining super-cycle driven by copper, lithium, and critical minerals demand. This requires no recession for five years, no political reversal on data centres, and no AI spending deceleration. The story is plausible but fragile.
Coherence Check: The story holds mechanically but requires four independent assumptions to remain true simultaneously. This is a “narrow path” story, not a “many ways to win” story.
Capital Allocation Engine (The Economic Machine)
For every $1 of incremental ME&T revenue:
• ~65 cents goes to COGS (materials, labour, manufacturing)
• ~13 cents to SG&A
• ~3 cents to R&D
• Operating profit: ~19 to 22 cents (at current margins)
• Tax (~21% effective rate): ~4 cents
• Owner earnings: ~15 to 17 cents per $1 revenue
Caterpillar’s stated policy is to return “substantially all” ME&T free cash flow to shareholders via buybacks and dividends. In practice:
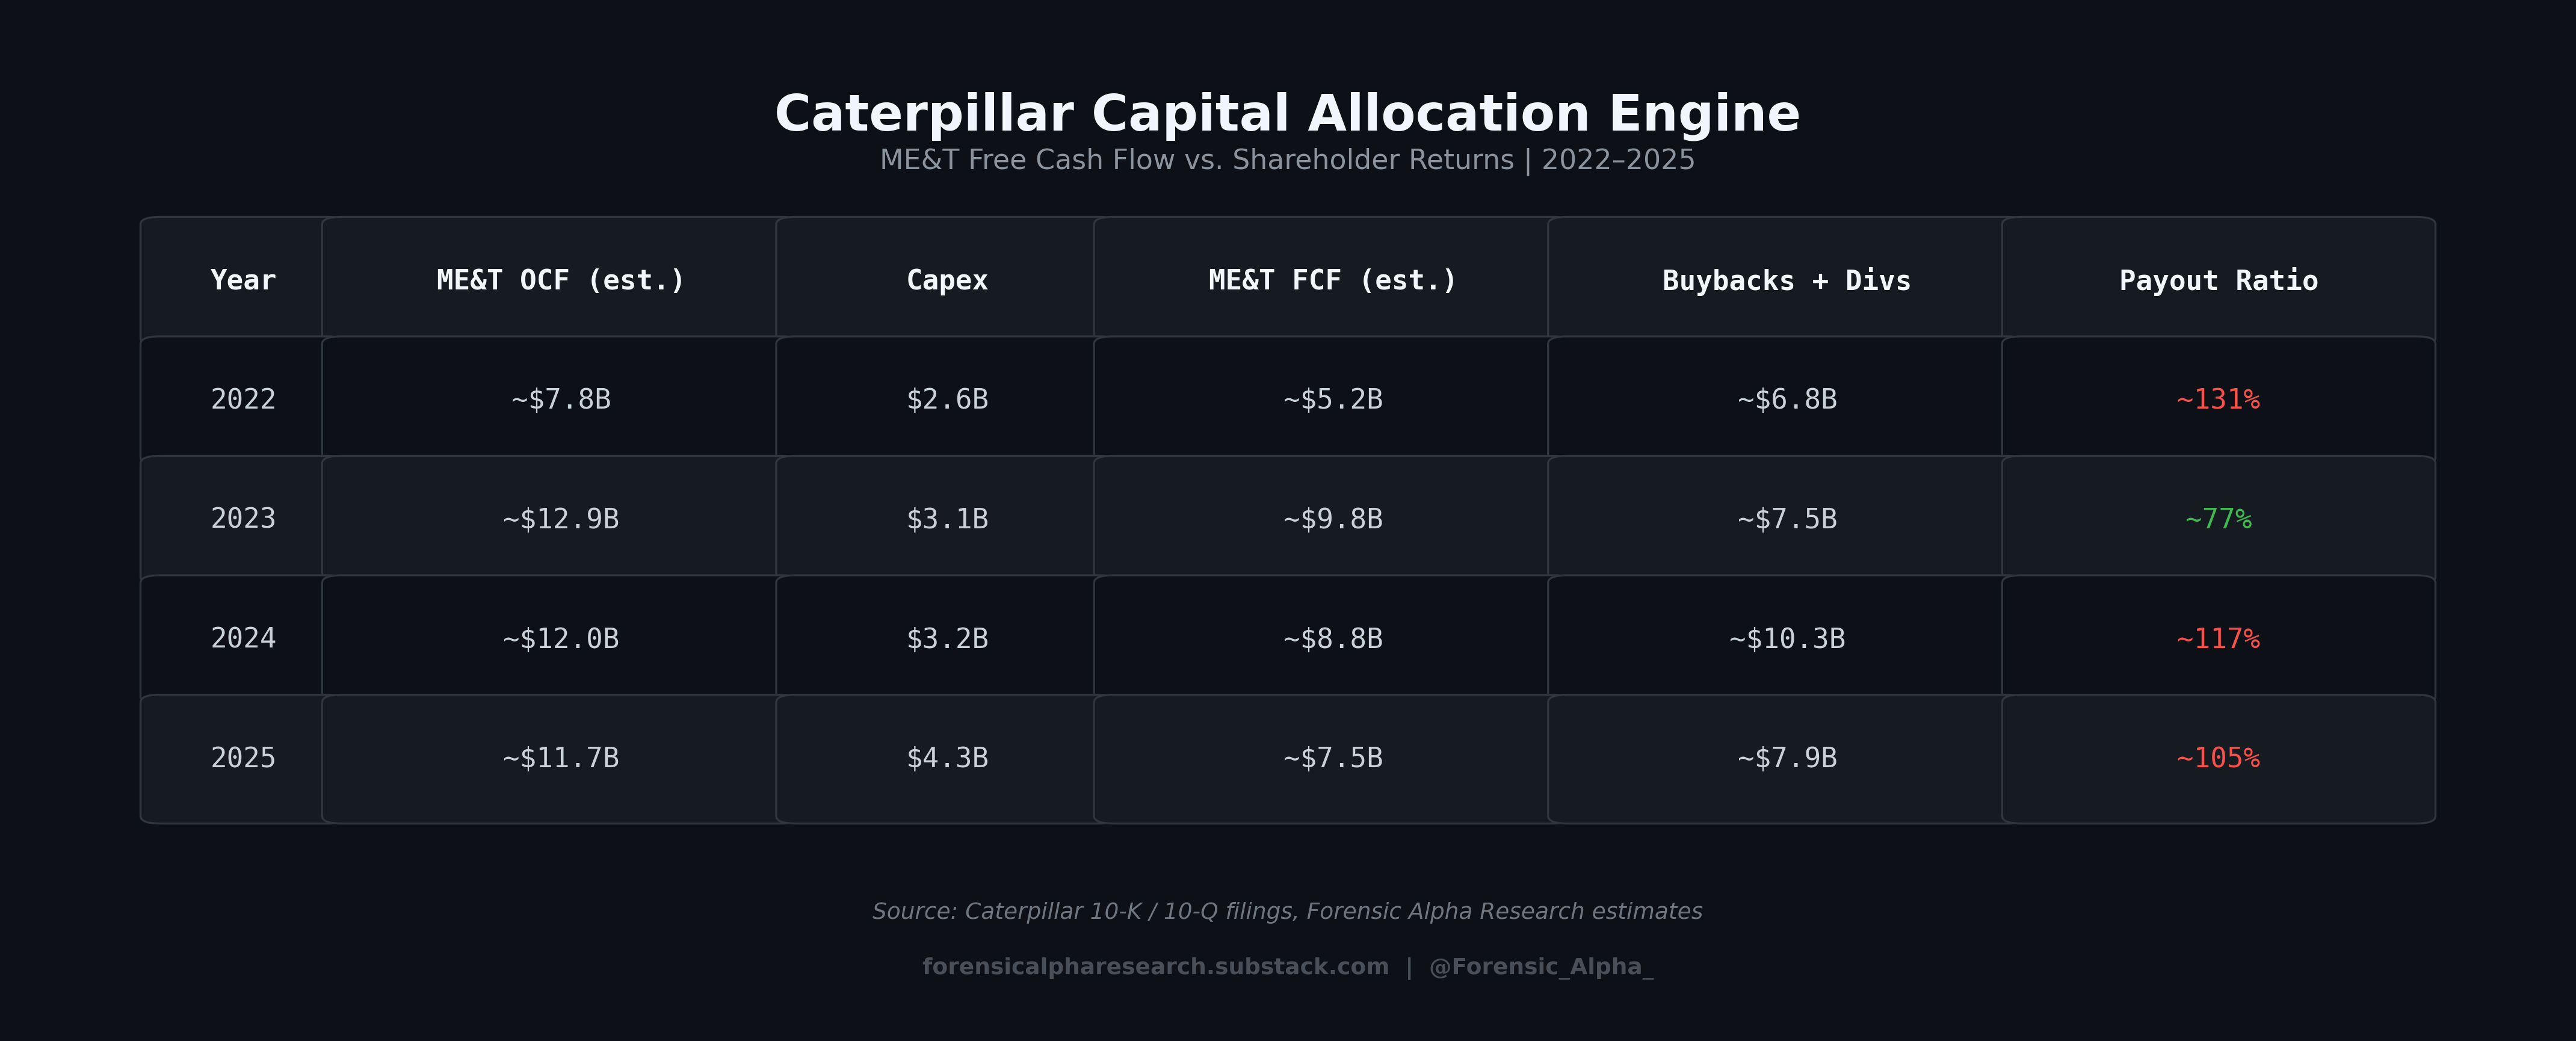
The company is returning more than 100% of FCF in most years, funding the excess via balance sheet leverage. This is sustainable while earnings grow; it becomes a trap if earnings contract and the buyback programme must slow while debt service remains fixed.
Reinvestment Saturation Curve: Capex jumped from $3.2B (2024) to $4.3B (2025), a $1.1B increase to fund the large-engine capacity tripling. The marginal ROIC on this incremental capex is not yet measurable because the capacity is still being built. If the new capacity generates revenue at the current Power & Energy segment margin (~24% operating), the implied ROIC on the $4 to $5B cumulative investment is roughly 20 to 25%, which is attractive. If utilisation disappoints (data-centre moratoriums, AI capex pullback), the ROIC on the last $1B of capex falls below the company’s WACC. No reinvestment fade detected yet. The risk is binary, not gradual.
Zero-Leverage Payback Period: Total interest-bearing debt: ~$44B. ME&T FCF (2025): ~$7.5B. Payback: ~5.9 years. This is at the boundary of the 5-year threshold, flagging moderate term-structure risk.
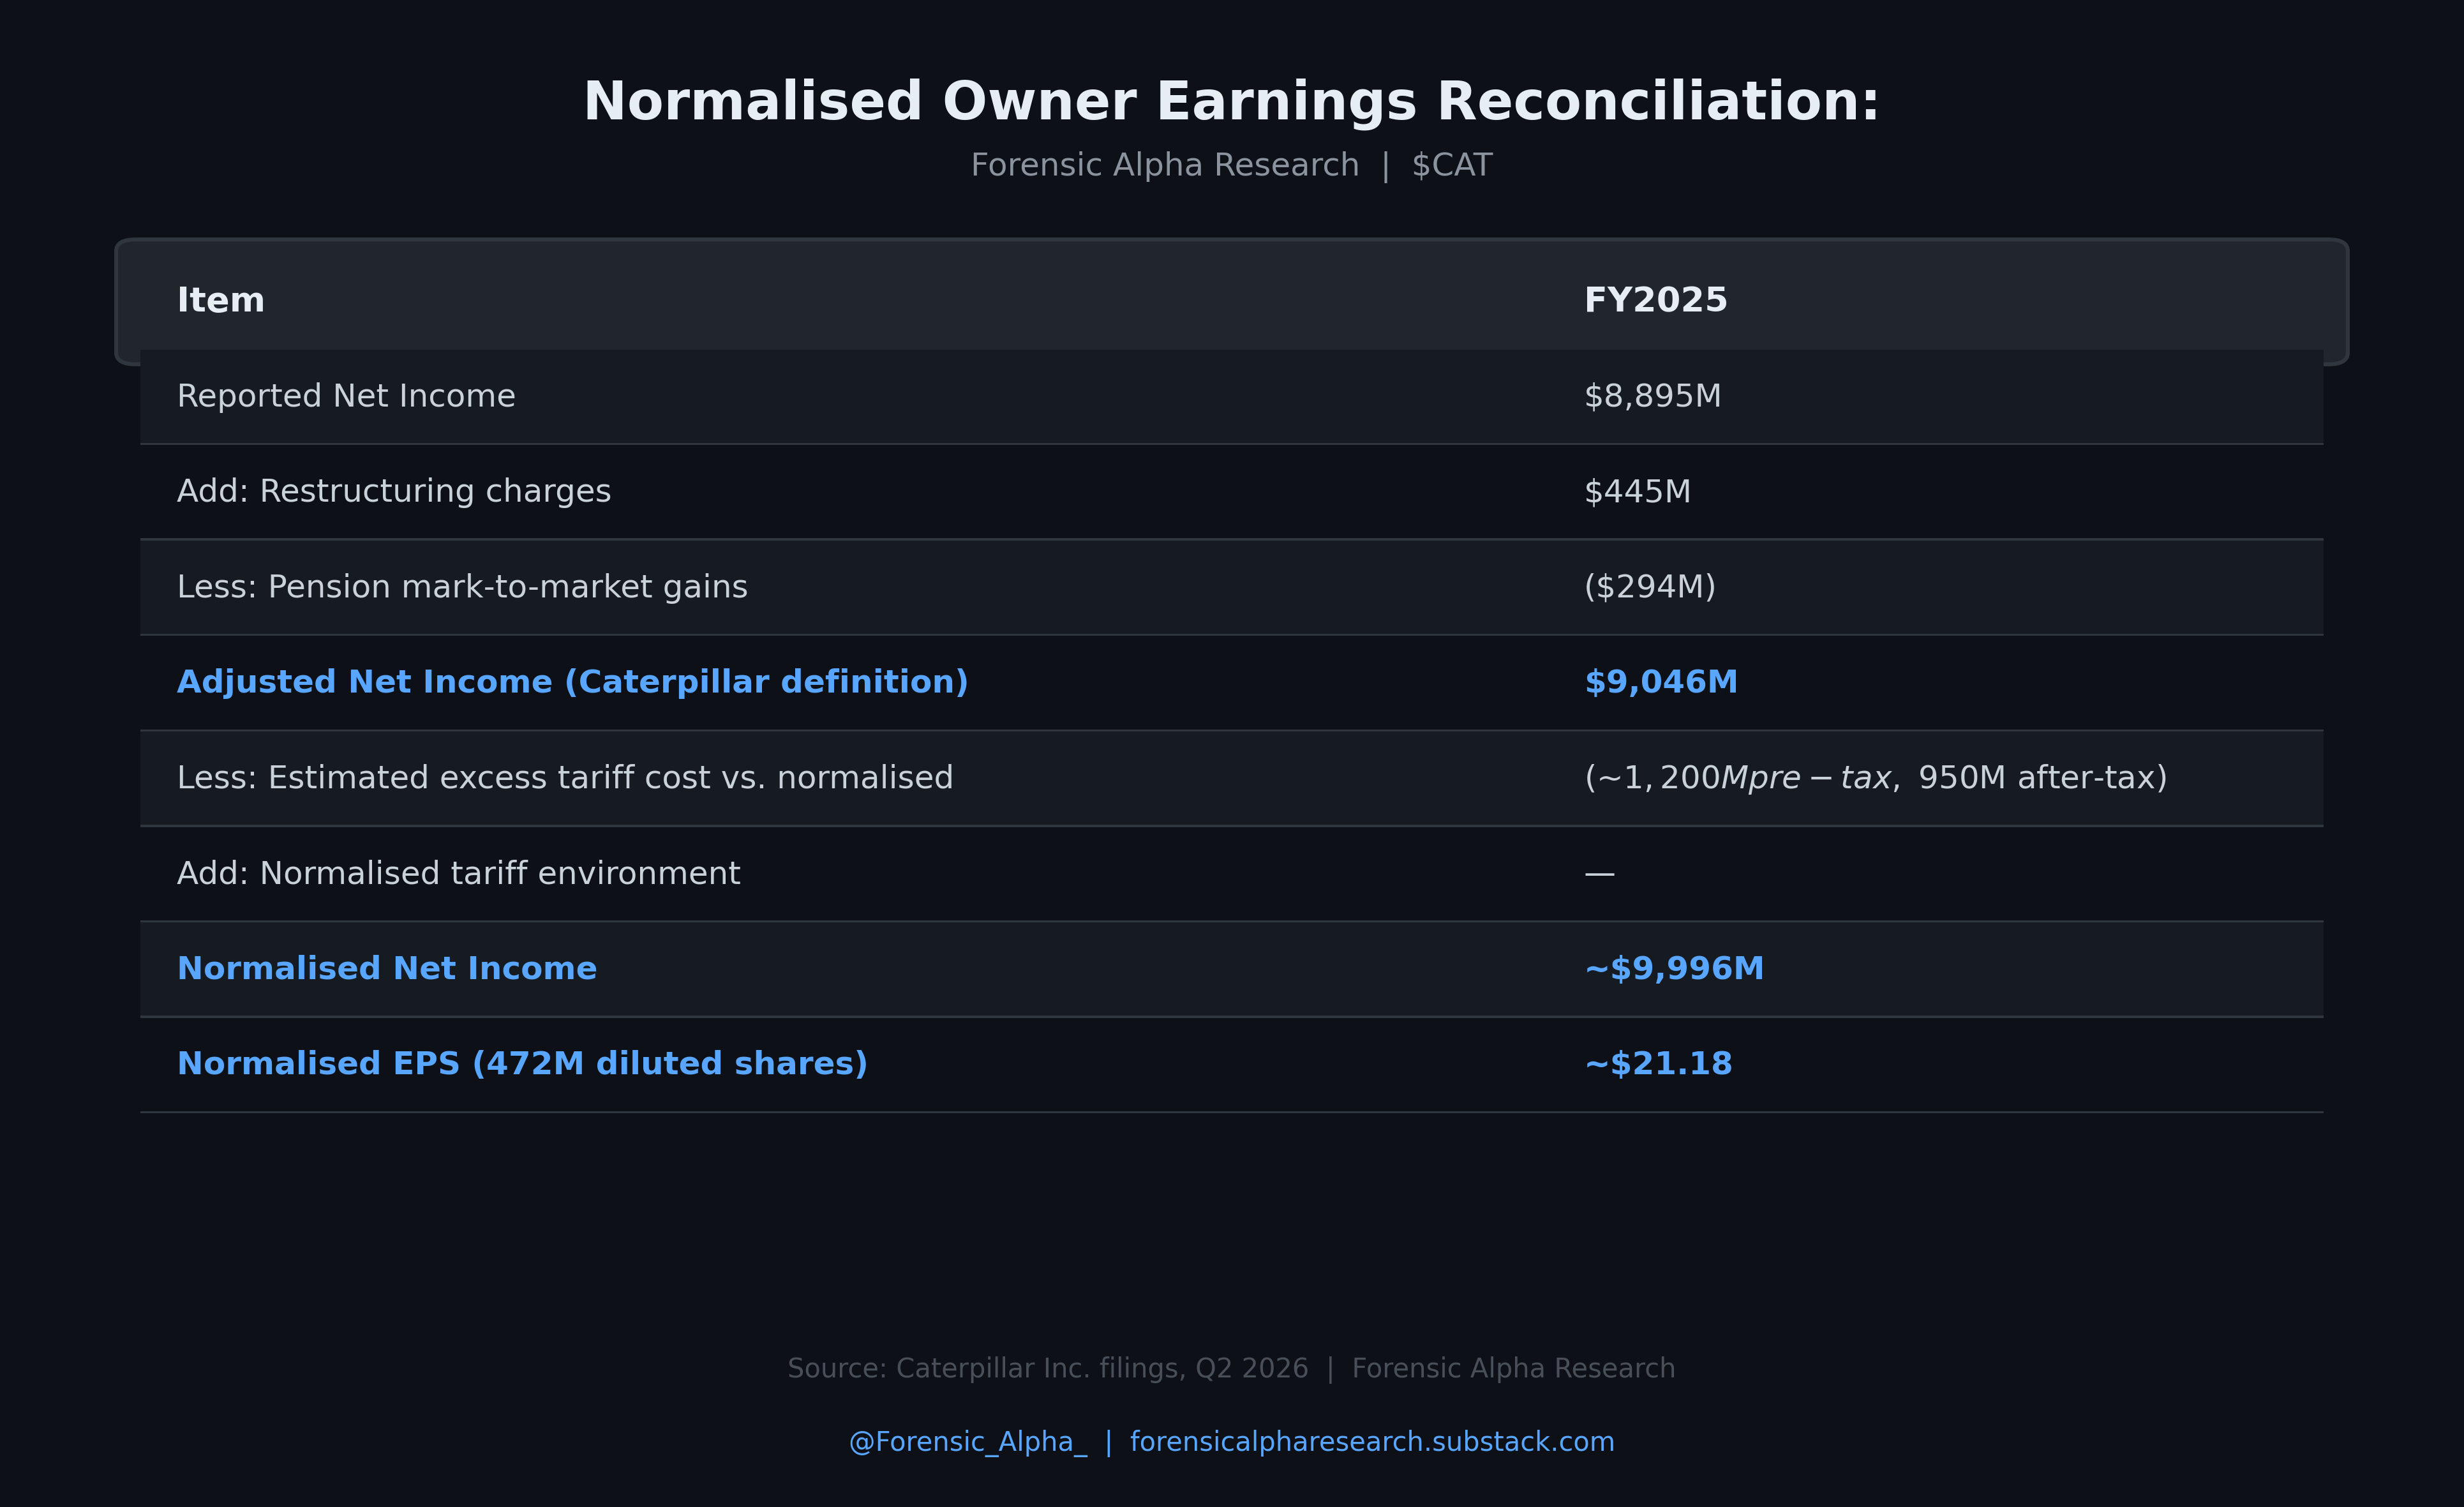
FY2025 reported EPS: $18.81. Adjusted EPS: $19.06. Our normalised EPS: ~$21.18 (adding back excess tariff burden above a normalised baseline of ~$500M). The tariff environment is abnormal. In a stable trade-policy world, CAT earns roughly $21 per share on $67.6B revenue. At $855 per share, the stock trades at ~40x normalised earnings.
For H1 2026 (adjusted EPS $13.70 annualising to ~$27+), we caution that Q2 included $392M in tariff recoveries and exceptional volume leverage. Normalised annual run-rate is closer to $23 to $25, yielding a forward P/E of 34 to 37x. Still historically expensive.
Charlie Munger’s Inversion Mental Model (Assumption Falsification Register):
1. Data-centre power demand sustains through 2030. Falsification: If hyperscaler capex guidance falls >15% in aggregate by Q2 2027, the backlog converts at a lower rate and Power & Energy revenue growth decelerates to single digits.
2. Construction activity remains above trend. Falsification: If US non-residential construction starts fall >10% for two consecutive quarters, the Construction Industries segment reverts to 2024-level revenue (~$23B annual).
3. Cat Financial credit quality remains benign. Falsification: If past-due receivables exceed 2.5% (vs. 1.31% today) for two consecutive quarters, the allowance must be rebuilt, absorbing $300 to $500M of earnings.
3. MANAGEMENT AND INCENTIVES
CEO Joe Creed took the role May 2025, succeeding Jim Umpleby (now Executive Chairman). Creed was COO from November 2023 and previously served as interim CFO, making him one of the most operationally and financially literate CEO candidates in the industrial sector. Total compensation in 2025: $17.0M (salary $1.38M, stock awards $9.5M, options $3.1M, bonus $2.5M). Approximately 92% of targeted compensation is variable and at-risk. LTI split: 50% performance RSUs (ROIC + relative TSR), 25% time-based RSUs, 25% stock options.
Qualitative Trust Test: Yes. Creed’s compensation is overwhelmingly performance-linked. The use of ROIC as a performance metric aligns management with capital efficiency. He has risen through the organisation across finance, energy, and operations. No evidence of self-dealing. The related-party disclosure (Creed’s brother-in-law is employed at Caterpillar) is immaterial in the context of a 115,000-person workforce.
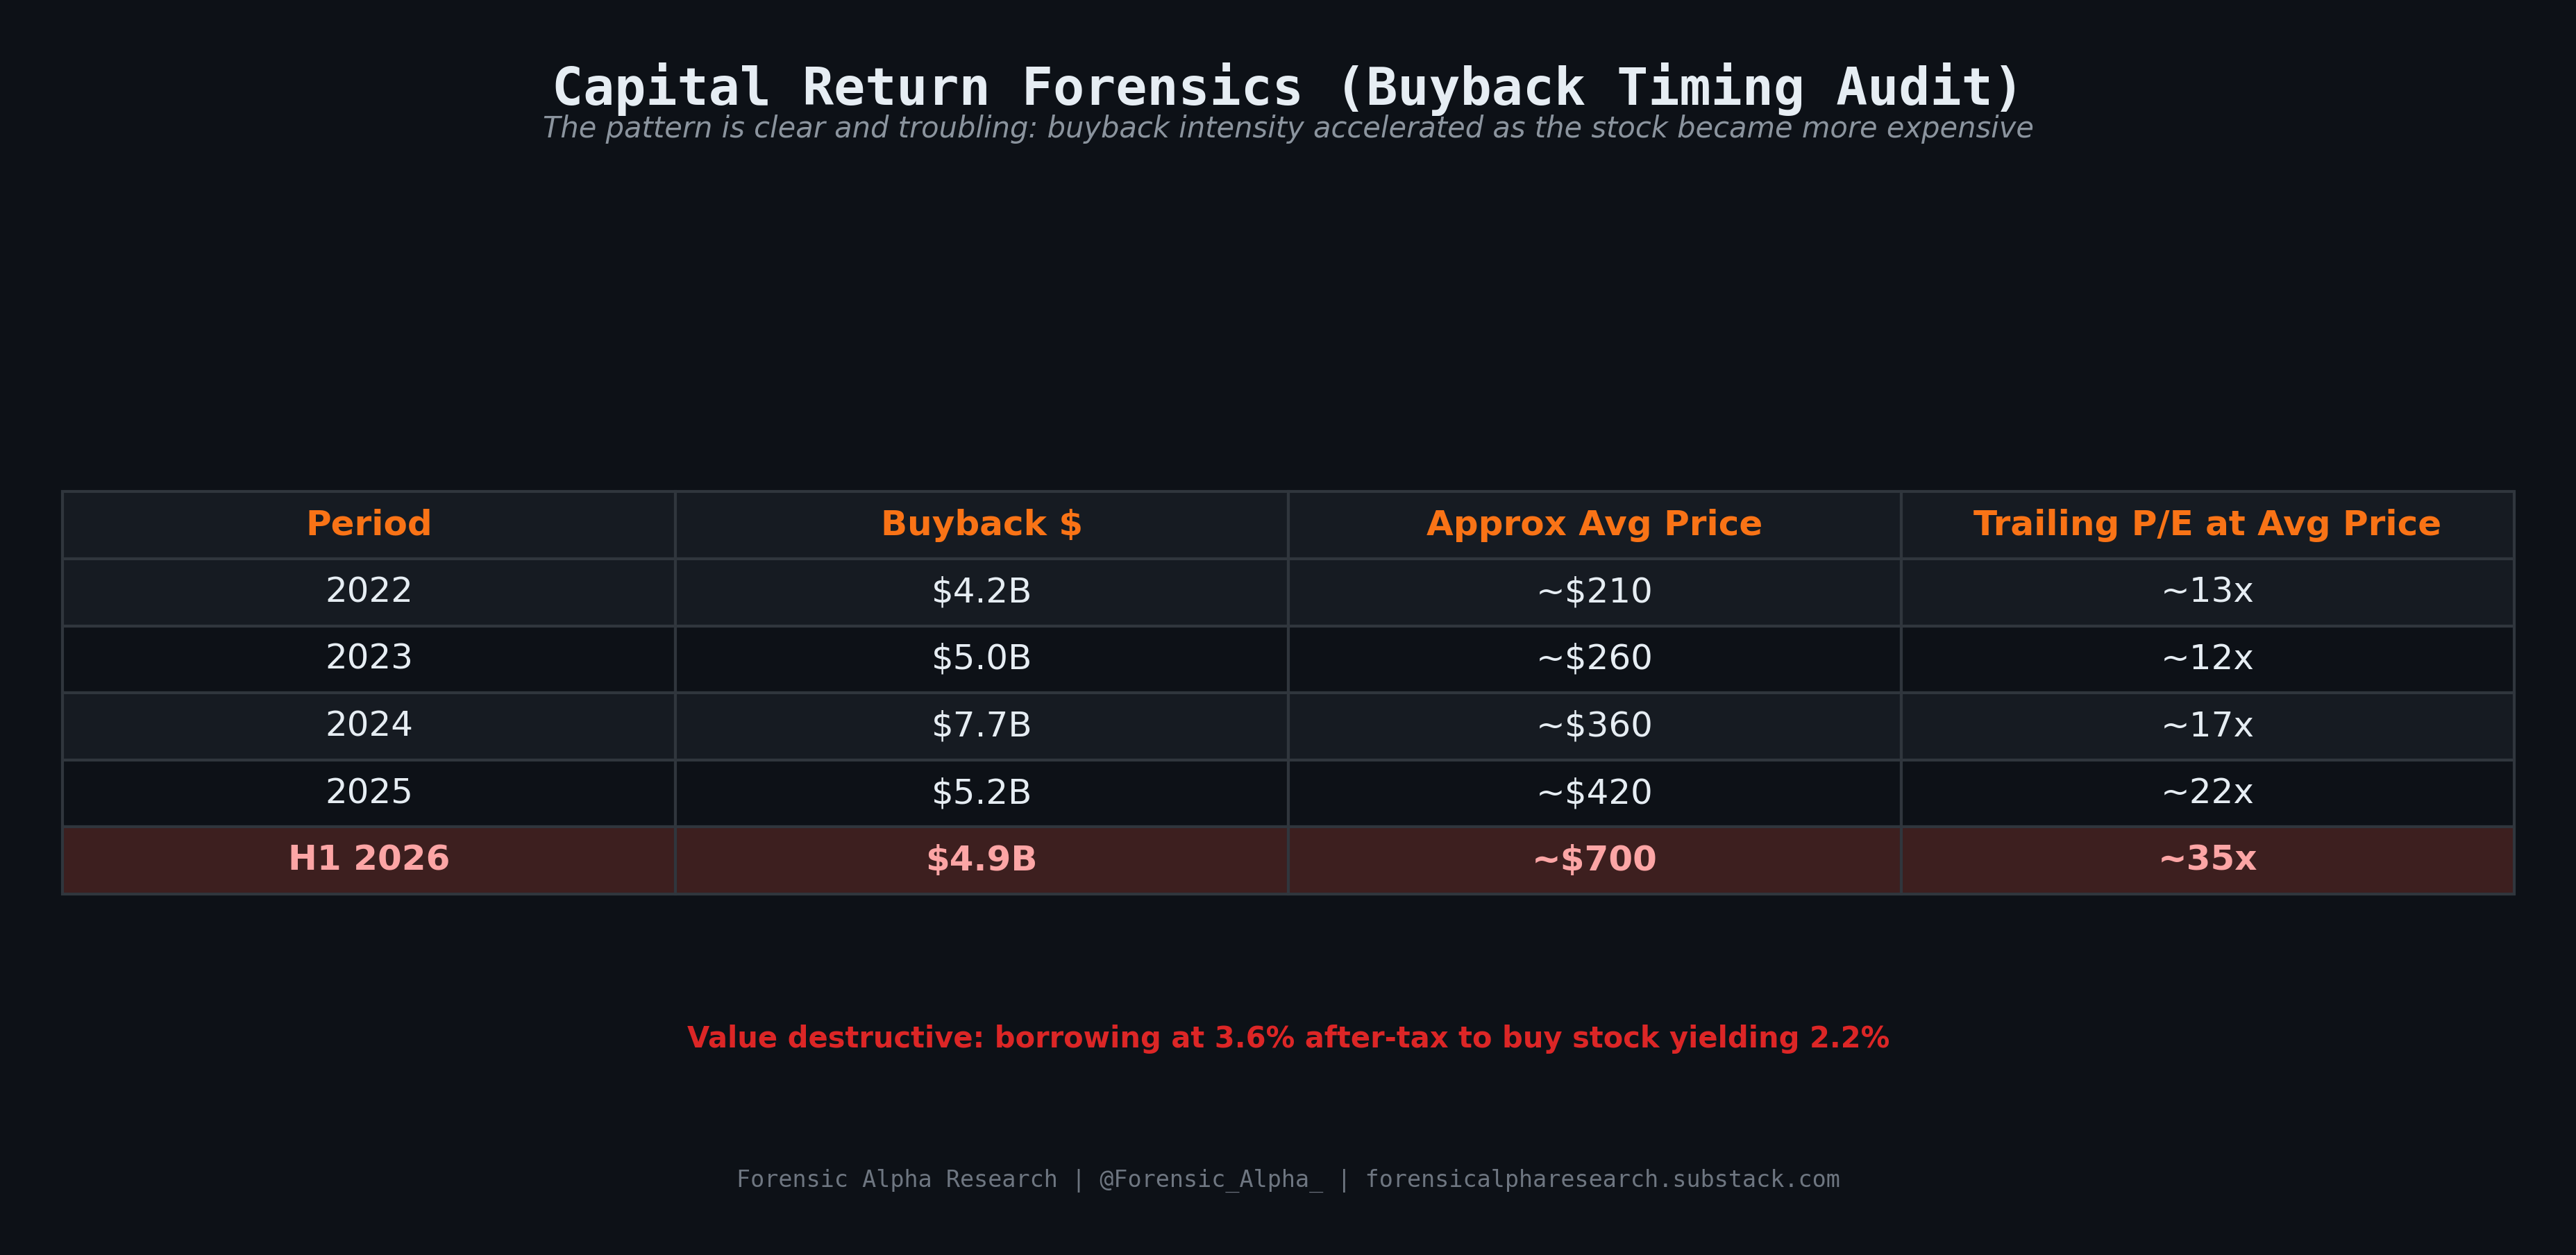
The pattern is clear and troubling: buyback intensity has accelerated precisely as the stock has become more expensive. In 2022 and 2023, management was buying at 12 to 13x earnings. Excellent. In H1 2026, the average repurchase price is roughly $700, or ~35x trailing earnings. At that price, the buyback yield (inverse P/E) is roughly 2.9%, well below the company’s pre-tax cost of debt (~4.5 to 5%). Management is now destroying value on the margin with every share repurchased at these prices.
Overpayment Penalty: The $4.9B deployed in H1 2026 purchased roughly 7 million shares at ~$700 average. If deployed at a more disciplined 20x earnings ($420 per share), the same capital would have retired ~11.7 million shares. The overpayment penalty is approximately 4.7 million shares, or roughly 1% of the float, permanently lost to valuation indiscipline.
Leverage Arbitrage Algebra: Caterpillar’s weighted-average pre-tax cost of debt is approximately 4.5%. The after-tax cost is roughly 3.6%. The FCF yield at $855 is approximately 2.2% ($7.5B FCF / $395B market cap). The spread is negative: Caterpillar is borrowing at 3.6% after-tax to buy back stock yielding 2.2%. Buybacks are value-destructive at current prices.
Break-even: Buybacks become value-neutral when the stock trades at approximately $520 (FCF yield = after-tax cost of debt at ~3.6%). Below $520, buybacks create value. Above $520, they destroy it.
Cessation Stress Test: If buybacks halt for 24 months, operating-only EPS growth is approximately 5 to 8% (revenue growth minus tariff/cost headwinds, no share-count tailwind). At 5% EPS growth for a cyclical industrial, the market would likely compress the multiple from 37x toward 20 to 25x. At 22x trailing EPS of $21 (normalised), the stock prices at ~$462. Buyback cessation implies approximately 46% downside from current levels.
Reflexive Death Spiral Check: A 25% FCF decline (from $7.5B to $5.6B) would force buybacks to slow to ~$3B annually (maintaining the dividend at $2.8B). EPS growth slows to 2 to 4%. Multiple contracts to 20 to 25x. Stock falls 40%+. At lower stock prices, SBC dilution becomes harder to offset. The trigger distance: a 25% FCF decline, which requires roughly a 15% revenue decline or a 400bps margin compression. Not exotic in a cyclical downturn.
Historical Execution Score: B. 2022 to 2023 buybacks were well-timed (cheap). 2024 to 2026 buybacks are increasingly poor (expensive). The programme lacks the valuation discipline of Apple (which slows buybacks at extreme valuations) and is moving toward IBM territory (buying regardless of price). Management’s stated policy of returning “substantially all ME&T FCF” regardless of valuation is structurally anti-disciplined.
SBC Dilution Check: Diluted shares outstanding fell from 489M (2024) to 465M (2025) to 462.5M (Q2 2026). This is a 2 to 3% annual share-count reduction, net of SBC dilution. SBC is immaterial relative to FCF for a $400B industrial. No stealth dilution.
Incentive Horizon Mismatch: CEO equity vesting is on a 3-year schedule. Caterpillar’s major assets (factories, engine production lines) have 15 to 25-year useful lives. The capacity-tripling investment will not prove out until 2028 to 2030. Creed will vest significant equity before the investment thesis is validated. Moderate mismatch, common in industrials, but worth noting.
4. FORENSIC ACCOUNTING TEARDOWN:
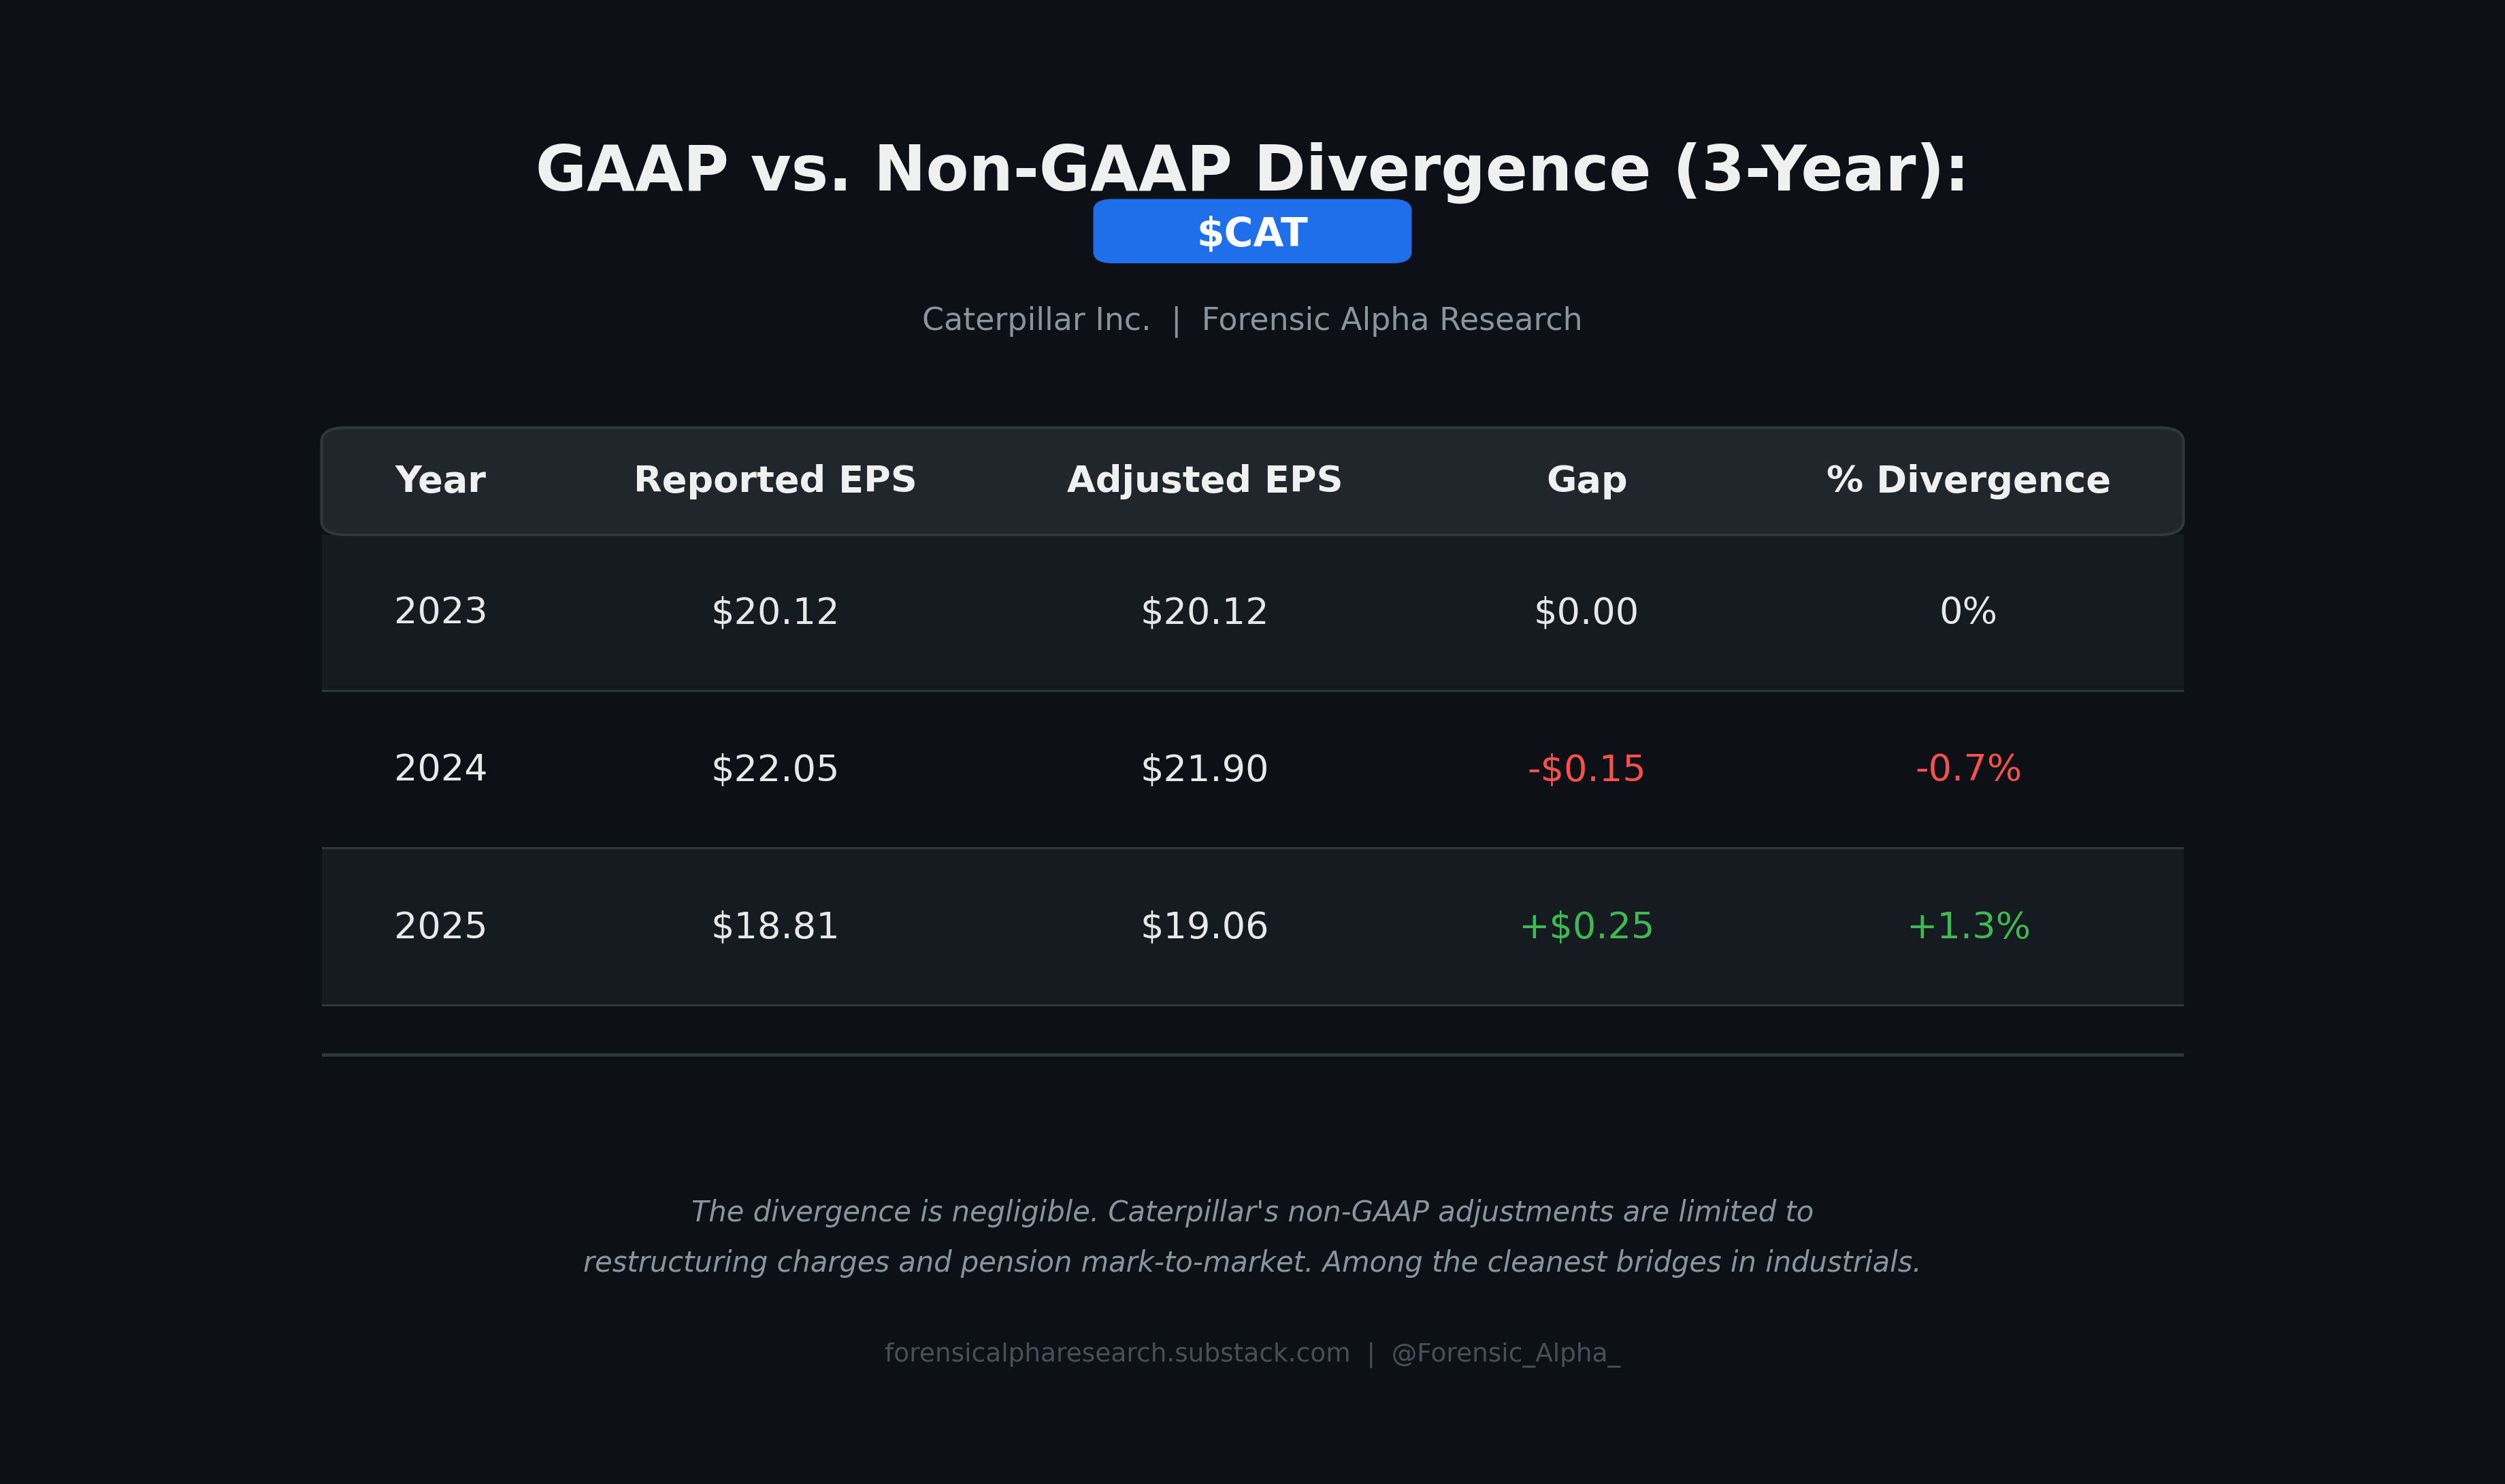
The divergence is negligible. Caterpillar’s non-GAAP adjustments are limited to restructuring charges and pension mark-to-market. This is among the cleanest GAAP-to-adjusted bridges in the industrial sector. No red flag.
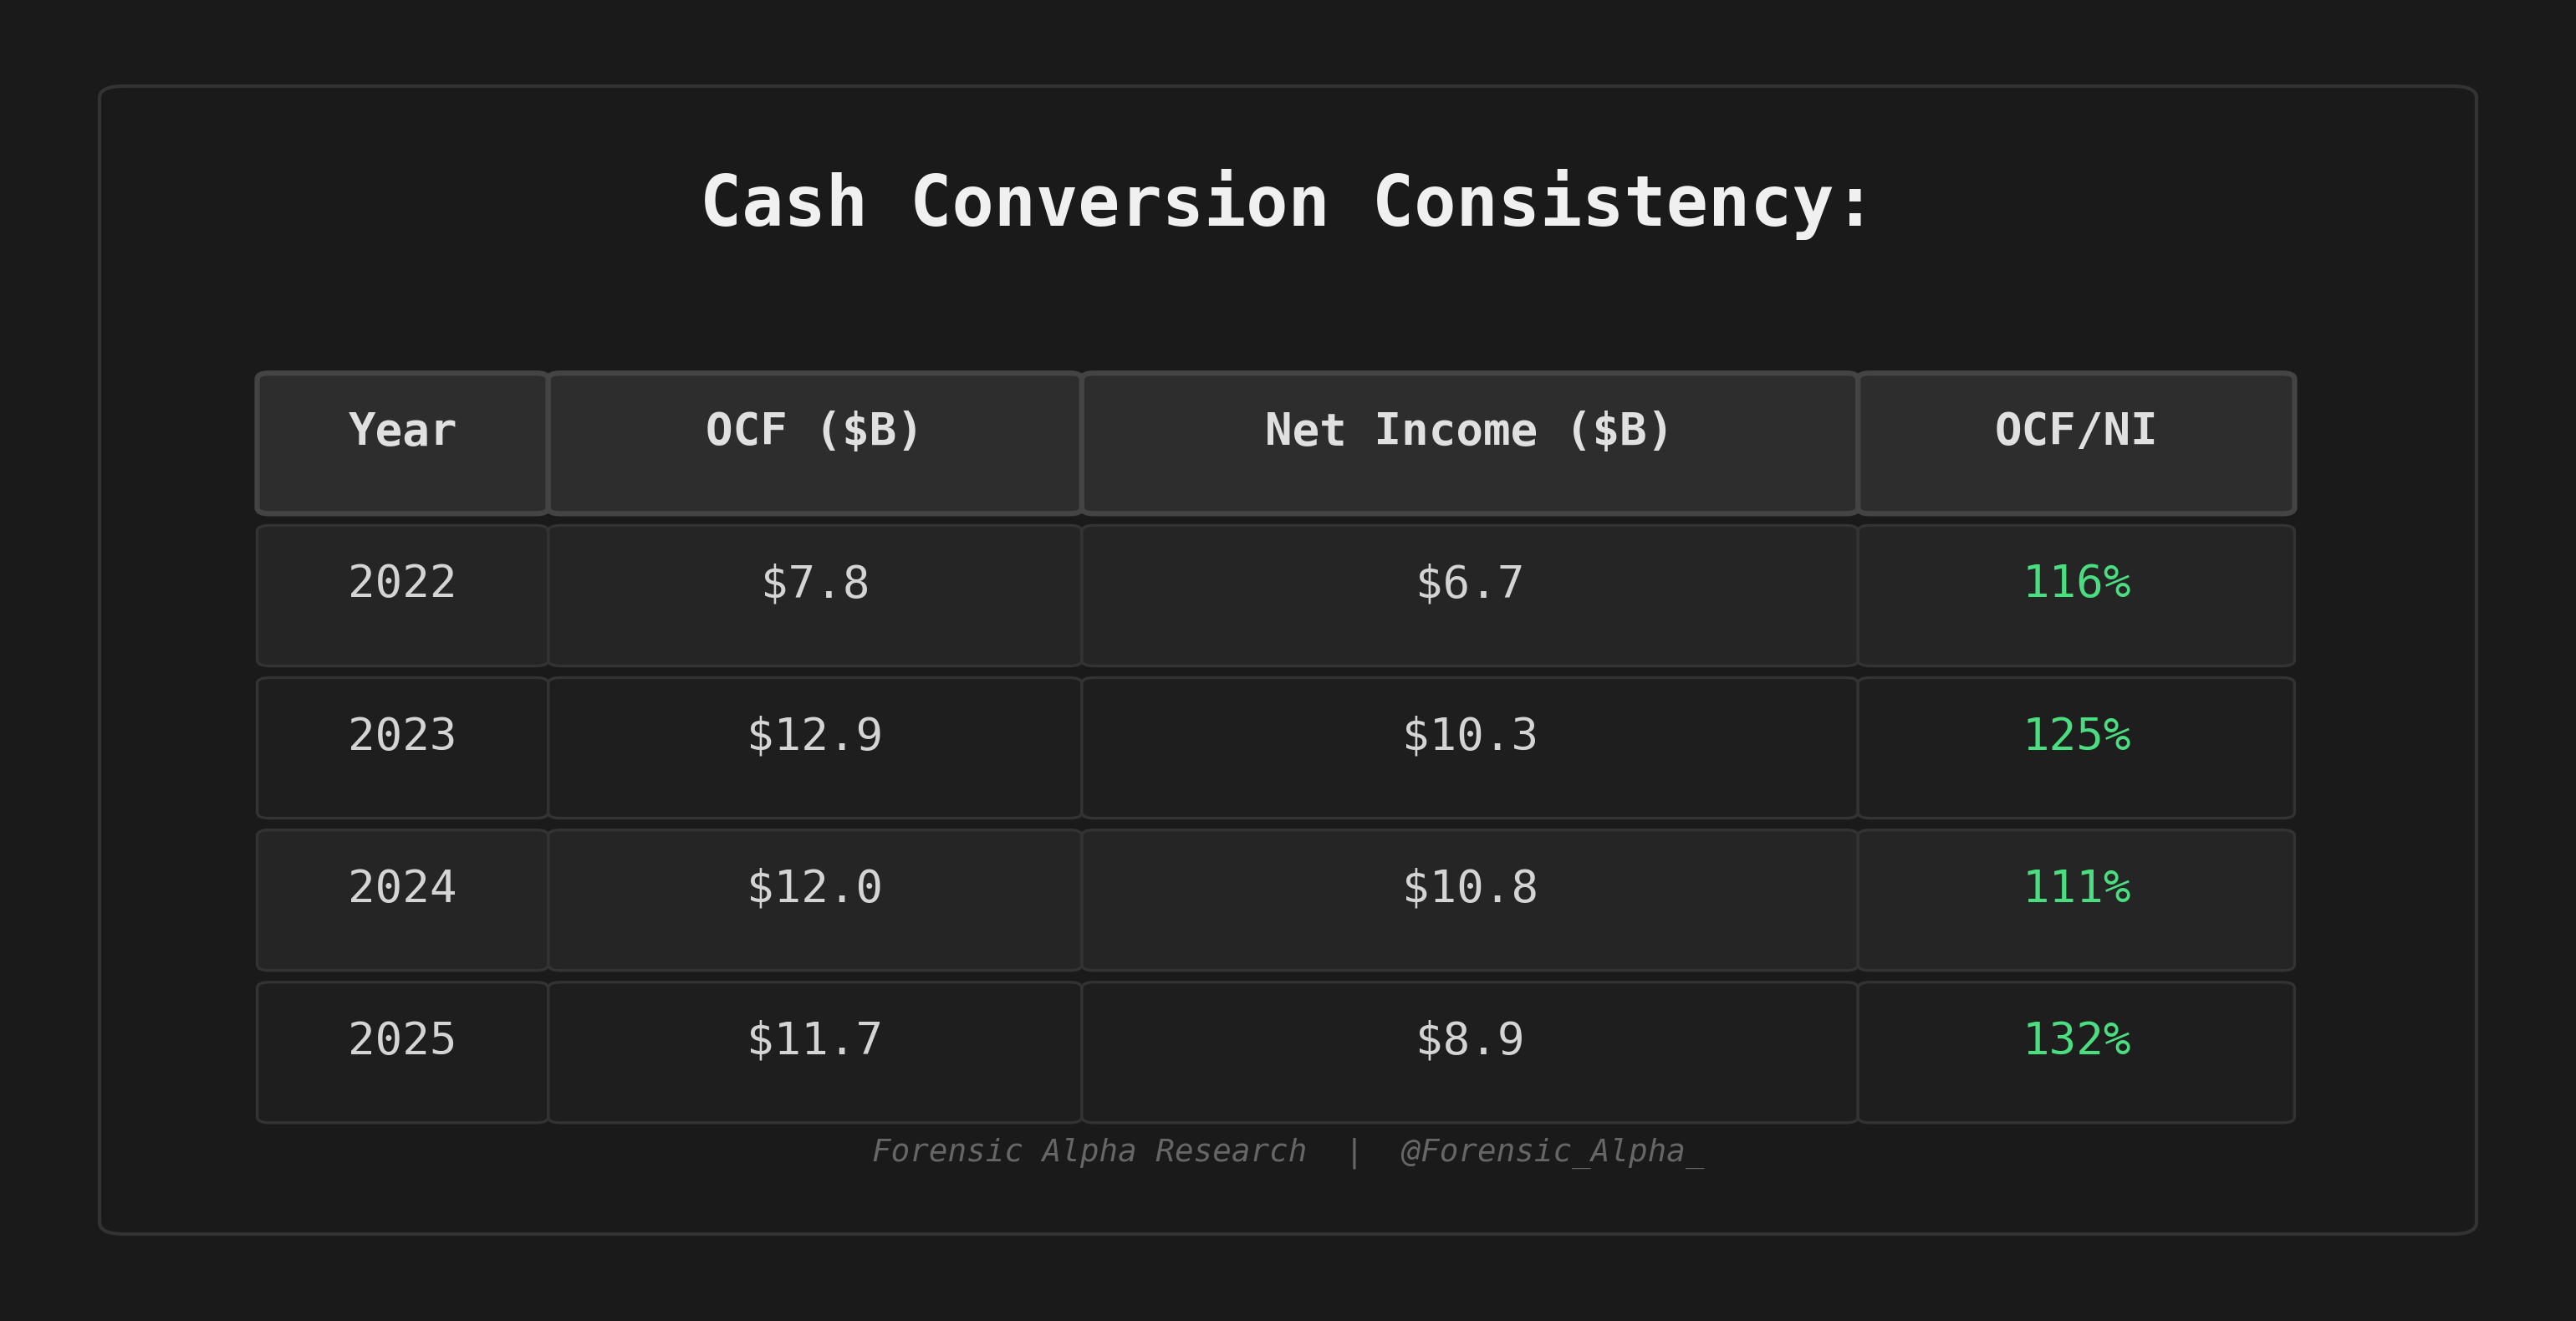
Cash conversion exceeds 100% in every year. The standard deviation is roughly 9%. This is a cash machine. No earnings-quality concern.
One-Off Recurrence Ratio: Cumulative “one-off” items (restructuring, divestitures, pension MTM) over 2022 to 2025: approximately $1.2B. Cumulative net income: ~$36.7B. Ratio: 3.3%. Below the 5% Valeant/GE threshold. Clean.
Operating Leverage Decomposition (FY2025 vs Q2 2026):
The single most important number for understanding CAT’s earnings volatility is the incremental margin. In FY2025, revenue grew from $64.8B to $67.6B (+$2.8B, or +4.3%), while operating profit fell from $13.1B to $11.1B (-$1.9B). The incremental margin was approximately -69%: every dollar of new revenue destroyed 69 cents of operating profit. The drivers:
In Q2 2026, the same operating leverage worked in reverse. Revenue grew +$3.97B YoY (+24%). Operating profit grew from $2.9B to $4.3B (+$1.4B). Adjusted operating profit expanded by an even larger amount (roughly +$1.9B). Incremental margin: approximately +45 to +48%.
This is not two different businesses. It is one business with high operating leverage. The market extrapolates the Q2 direction; the forensic reality is that direction can reverse in a single quarter of tariff or volume shock. Pricing 37x trailing earnings for a business whose incremental margins can swing from -69% to +48% within four quarters is not conservative underwriting.
Confidence: High.
Footnote Autopsy:
• Pension: Caterpillar’s US pension plans are overfunded. No optimistic discount-rate gaming detected.
• Related-Party Transactions: CEO’s brother-in-law employed at market-rate compensation. Immaterial.
• Auditor: PricewaterhouseCoopers, serving since 1925 (the company’s founding year). 101 years of auditor tenure. This flags “Auditor Capture Risk” under our framework. In practice, PwC is among the Big Four and rotates audit partners. The risk is theoretical, but we note it.
• Board Composition: 11 of 13 directors are independent. CEO Creed is not Chairman (Umpleby holds the Chairman title as Executive Chairman). Adequate governance. No captured-board flag.
5. ASSET QUALITY AND HIDDEN VALUE
Cat Financial (the Embedded Bank):
Cat Financial had total assets of $40.5B at Q2 2026, with $35B+ in finance receivables. This is a mid-sized bank by any measure, embedded inside an industrial company. Key metrics:
• Past dues: 1.31% (Q2 2026), down from 1.62% a year ago
• Allowance for credit losses: $294M (0.84% of receivables)
• Net write-offs: $20M in Q2 (annualised: ~$80M, or 0.23% of receivables)
• Finance receivables grew 13% YoY in 2025 ($32.8B from $29.0B)
Collateral Quality Audit: Cat Financial’s loans are collateralised by Caterpillar equipment. Who verifies the collateral? Caterpillar’s own dealer network appraises and resells equipment. The incentive structure is circular: Cat Financial lends to buy Cat equipment, Cat dealers appraise the equipment’s residual value, and the same dealer network handles remarketing if the borrower defaults. In a downturn, used-equipment prices fall precisely when delinquencies rise, creating a correlated-loss problem.
The allowance at 0.84% is thin by banking standards. For comparison, US banks typically reserve 1.3 to 1.6% of loans. Cat Financial’s loss history justifies the lower reserve in normal times, but the portfolio has roughly tripled since the last severe downturn (2008 to 2009, when write-offs exceeded 2% of receivables).
Stress Scenario: If past dues rise to 3% (2008 to 2009 levels) and loss-given-default is 40% (used-equipment values fall 30% in a recession), the required provision increase is approximately $600M to $800M, or roughly $1.00 to $1.30 per share after-tax. Painful but not existential. However, this coincides with the equipment revenue downturn, creating double jeopardy.
Hidden Assets:
• Caterpillar holds significant real estate (manufacturing facilities globally). Book value of PP&E: approximately $17.5B. Replacement cost is likely 30 to 50% higher (~$23 to $26B), implying $5 to $9B of hidden real-estate value.
• The dealer network (2,700+ independent dealers) is not on the balance sheet but represents enormous franchise value.
• Brand value: CAT is among the most recognised industrial brands globally.
Hidden Liabilities:
• Operating lease obligations: $728M (10-K disclosed, Q4 2025)
• Pension obligations: well-funded, immaterial net liability
• Tariff contingency: the $2.2B 2026 tariff estimate could increase if trade policy worsens
• Litigation: no material outstanding cases noted in recent filings
Net Hidden Value per Share: After adjusting for PP&E undervaluation and netting liabilities, we estimate roughly $10 to $15 per share in net hidden asset value. This is immaterial at an $855 stock price.
6. MOAT, INDUSTRY, AND DISRUPTION
Moat Type: Multi-layered. (1) Installed base and switching costs: customers who own Cat equipment are locked into the Cat parts and service ecosystem. The aftermarket (parts + service) generates recurring, high-margin revenue. (2) Dealer network: 2,700+ independent dealers represent decades of accumulated distribution infrastructure that no competitor can replicate quickly. (3) Financial captive: Cat Financial lowers the total cost of ownership and creates a financing moat. (4) Brand: “Cat” is synonymous with heavy equipment in most global markets.
Moat Durability Score: High. Caterpillar’s moat has survived multiple deep cyclical downturns, competitive assaults (Komatsu, Volvo, SANY, Hitachi), and technological transitions. The installed base, dealer network, and parts ecosystem create 20+ year visibility.
Switching Cost Quantification: For a mid-sized contractor, switching from Cat to Komatsu involves: (a) retraining operators ($5,000 to $15,000 per operator), (b) parts inventory write-down (Cat-specific parts become stranded), (c) dealer-relationship disruption, (d) downtime during transition (3 to 6 months of reduced utilisation). Total switching cost for a 20-machine fleet: approximately $300,000 to $700,000. This is material relative to the annual operating budget of a mid-sized contractor. The moat on the traditional equipment business is genuine.
Disruption Timeline (Data Centre Dependency Risk):
The new growth vector (Power & Energy for data centres) faces a different competitive and regulatory dynamic than traditional construction. Three risks:
1. Political moratorium risk. 75 data-centre projects blocked in Q1 2026. If moratoriums spread to Texas (Caterpillar’s home state and a major data-centre market), the growth thesis takes a direct hit. We assign a 20 to 30% probability of meaningful regulatory deceleration within 24 months.
2. Alternative power technology. Data centres are exploring nuclear (small modular reactors), fuel cells, and direct grid connections. If SMRs become viable by 2030, gas-turbine and reciprocating-engine demand from data centres peaks earlier than the market expects. We assign a 15 to 25% probability that alternative technologies erode Cat’s data-centre power TAM by 2032.
3. Hyperscaler concentration. A handful of customers (Microsoft, Amazon, Google, Meta) drive the bulk of data-centre demand. If any single hyperscaler pauses capex for 6+ months, the backlog conversion rate slows materially. This is a customer-concentration risk disguised as a broad market trend.
Price Growth Phase: Mature Growth transitioning to Rapid Growth. Revenue growth at 22 to 24% is in the Rapid Growth range, but this is cyclical acceleration, not structural. The valuation multiple of 37x is consistent with a Rapid Growth classification. Historically, cyclical industrials in Mature Growth trade at 15 to 22x. The market is paying a Rapid Growth multiple for what may prove to be a cyclical peak. Valuation is inconsistent with the company’s long-run growth phase.
7. MACRO AND STRUCTURAL HAZARDS
Macro Regime (August 2026): US GDP growth is moderate. The Fed has held rates steady. The 10-year Treasury yield is approximately 4.6%. Credit spreads are tight. The labour market is cooling but not contracting. Construction spending is elevated by data-centre investment and infrastructure legislation (IIJA, CHIPs Act).
Classification: Thermometer. Caterpillar’s revenue has historically correlated with GDP at R² > 0.6 over 20-year periods. The current decorrelation (revenue growing 24% while GDP grows ~2%) is entirely attributable to the data-centre super-cycle. If data-centre investment normalises, Caterpillar reverts to thermometer status.
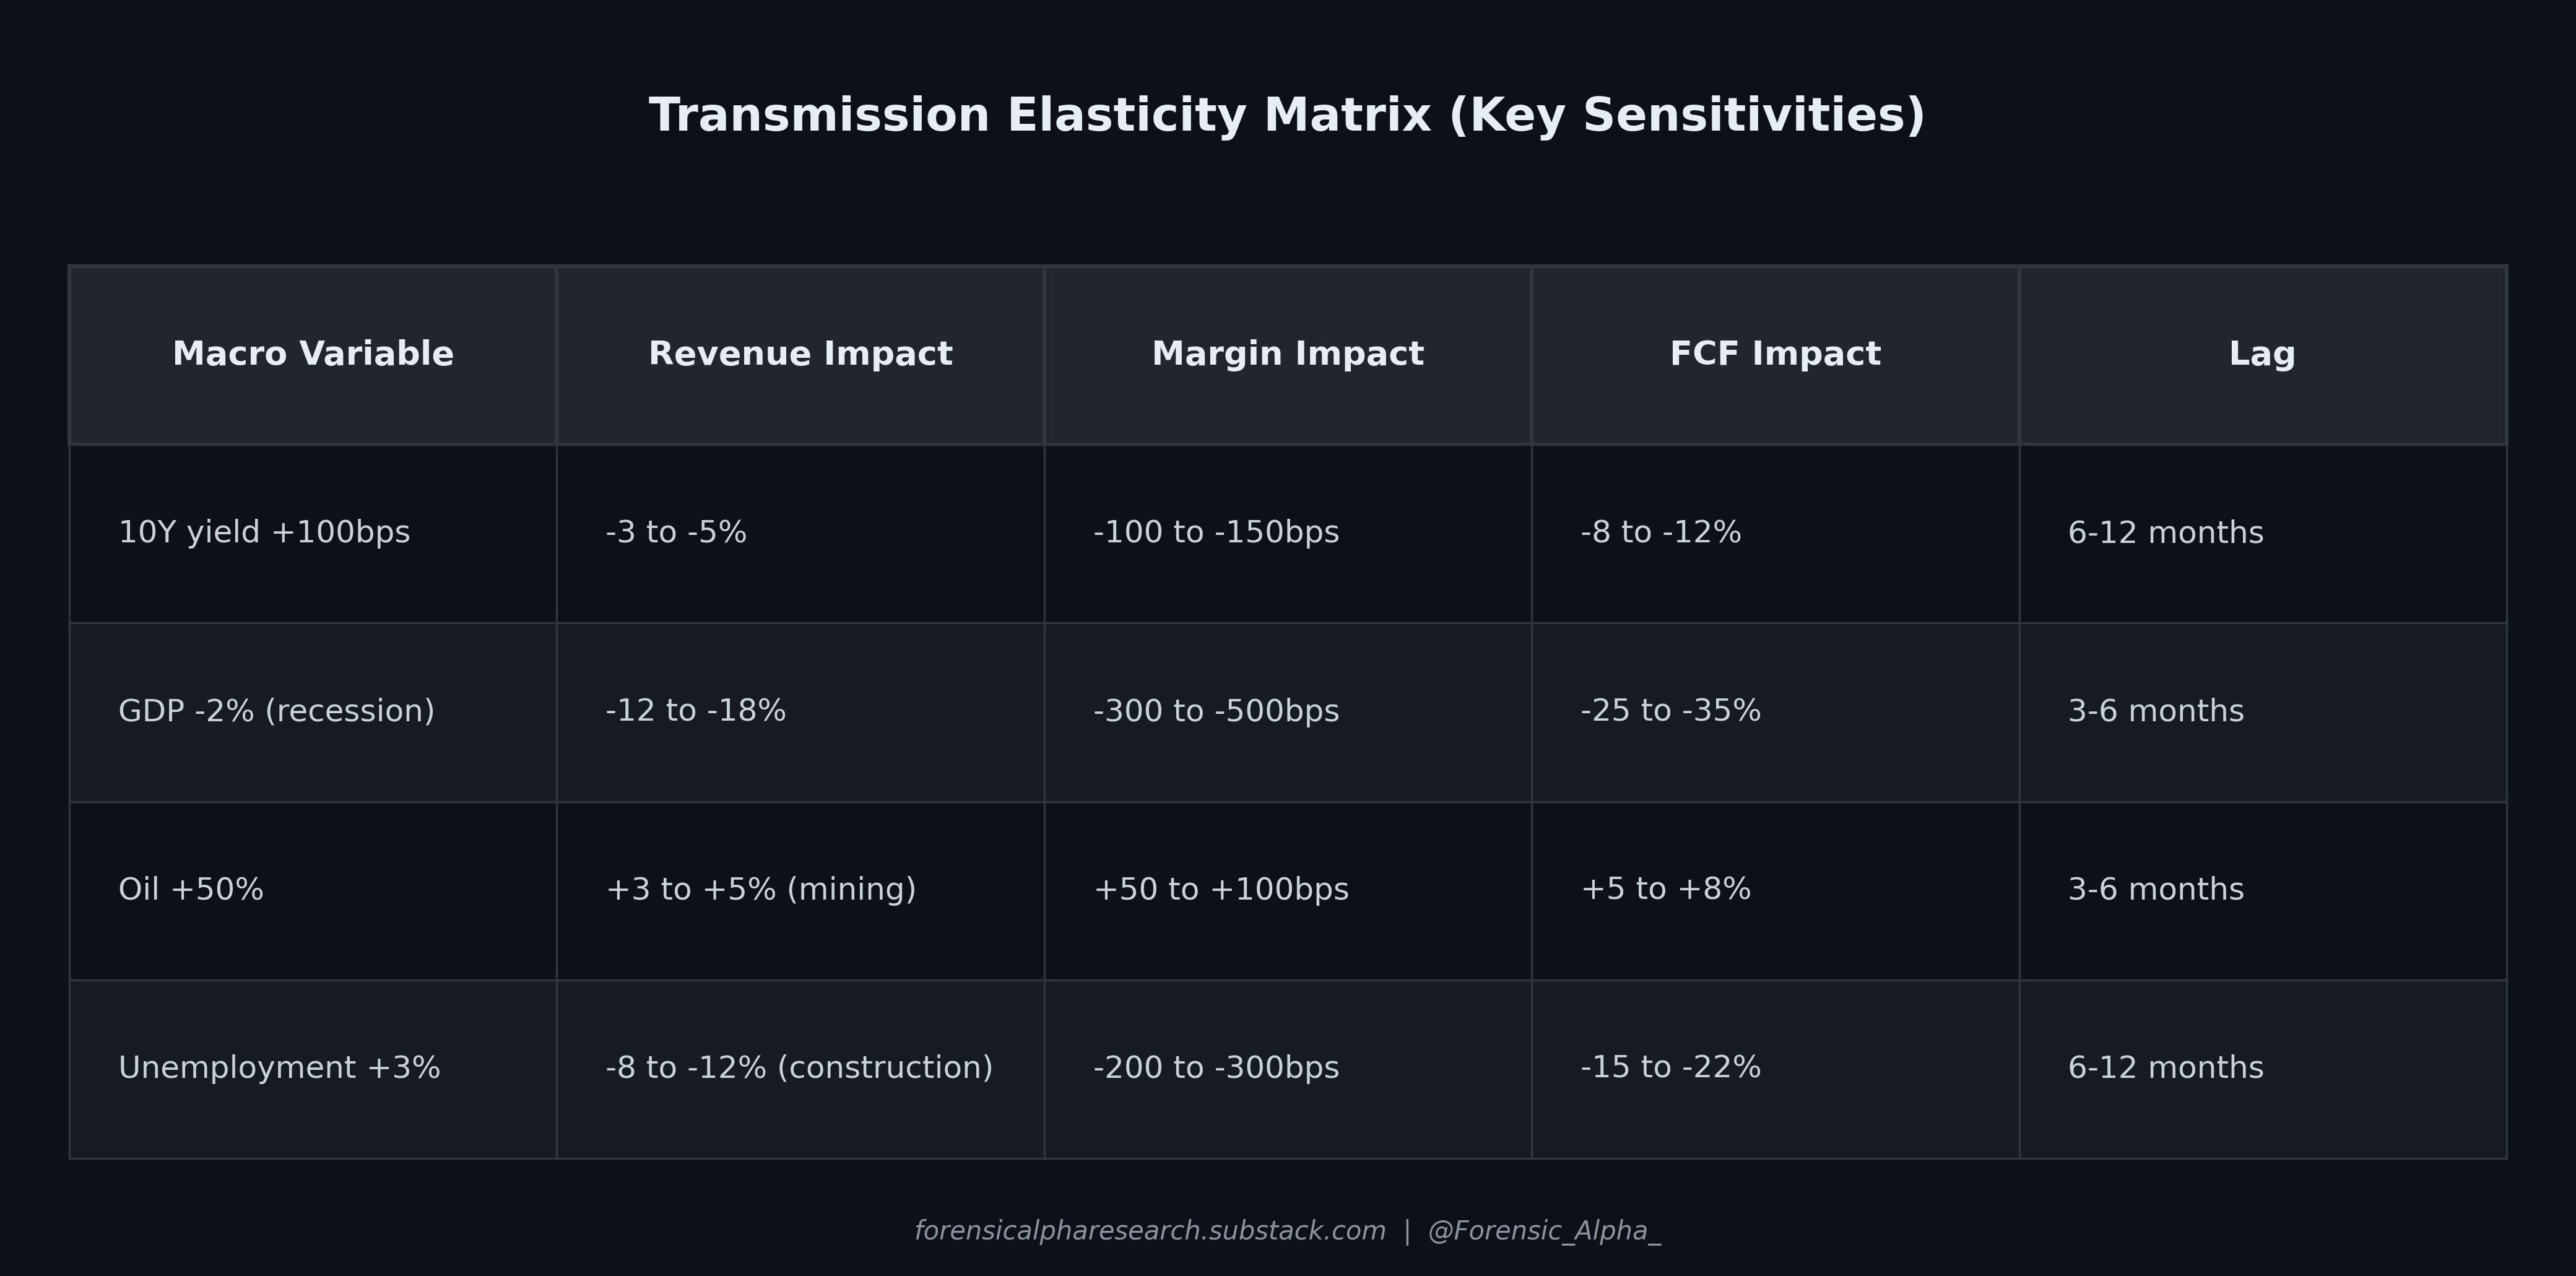
Rate Sensitivity of Capital Structure: Total debt: $44B. Estimated weighted-average coupon: ~4.5%. A +200bps parallel shift increases annual interest expense by approximately $350 to $500M (on floating and maturing portions). Interest coverage at current EBITDA (~$17.5B TTM) is approximately 7.5x. Rate breakeven (coverage falls below 2.5x): 10-year yield would need to exceed ~11%. Not a near-term risk, but the $44B debt load constrains financial flexibility in a downturn.
Debt Cycle Map: We are mid-to-late cycle. Credit is available but spreads are tight (complacency signal). Cat’s weighted-average debt maturity is approximately 5 to 6 years (estimated from the maturity ladder: $7.1B maturing within 1 year, $5.5B short-term, ~$30.7B long-term). The near-term maturity wall ($12.6B within 12 months) requires refinancing, likely at higher rates than the maturing tranches. Rollover risk is manageable given the company’s A-rated credit, but refinancing $12.6B annually is not trivial.
Structural Hazards Audit:
We are expressing a view through common equity. No structural complexity in the instrument. However, the company itself carries structural complexity through Cat Financial:
• Cat Financial funds itself via $32.6B in external borrowings (commercial paper, medium-term notes, asset-backed securities). This is effectively a shadow bank embedded in an industrial company.
• The counterparty risk is dispersed (thousands of equipment borrowers) but correlated (all exposed to construction/mining cycles).
• The off-balance-sheet exposure is limited. Cat Financial uses securitisation programs, but these are disclosed and the retained interests are on-balance-sheet.
Structural Hazard Flag: Yellow. Not “Weapons of Mass Obfuscation,” but the embedded $35B+ lending book adds complexity that the market may underappreciate. In a stress scenario, Cat Financial becomes a drag on the parent, not a diversifier.
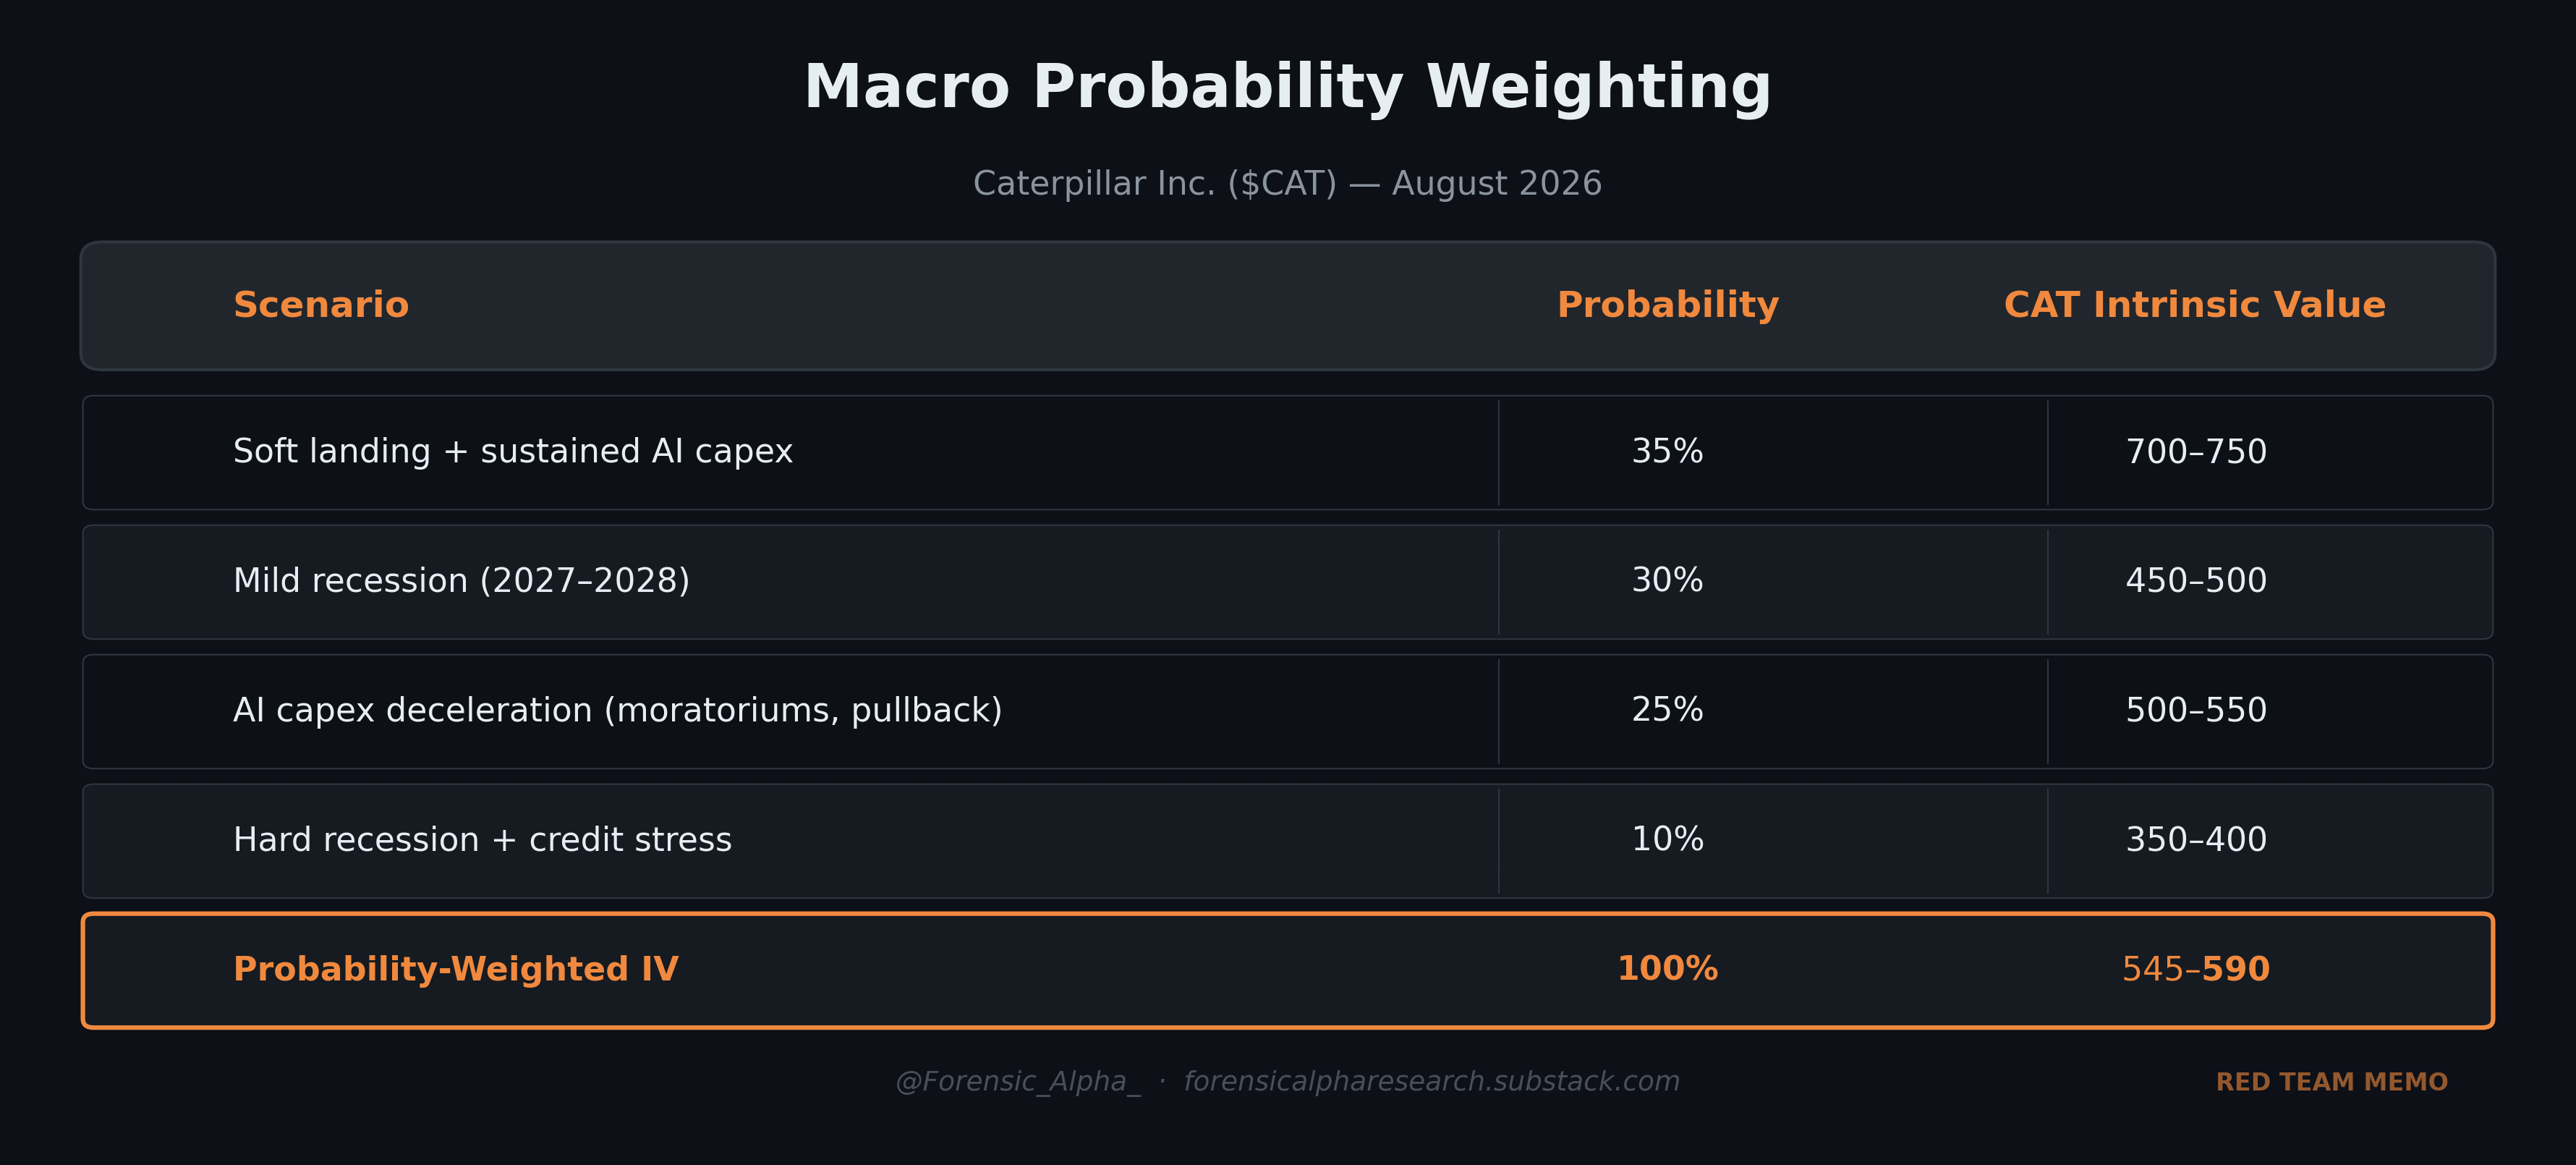
The upweighting of the AI-capex-deceleration scenario (from 20% to 25%) reflects the 75 data-centre projects worth $130B blocked or delayed in Q1 2026 alone, plus active moratoriums in Maine, Seattle, and New York state. This is not a tail risk; it is a base-rate observation.
Macro Kill Condition: If recession probability exceeds 40% (per Fed models, yield-curve signals, or credit-spread widening >200bps from current levels), the investment thesis is invalidated regardless of backlog size, because backlog cancellations and deferrals accelerate in recessions.
8. MISPRICING AND REFLEXIVITY
Contrarian Deconstruction:
The market is pricing in three consensus fears:
1. Tariffs will erode margins permanently. Partially wrong: CAT has demonstrated pricing power sufficient to offset tariffs (price realisation of $595M in Q2 alone). But the offset is not free; it comes via price increases to customers, which eventually dampens demand.
2. The data-centre boom is a bubble. Partially right: the demand is real today (confirmed by hyperscaler capex commitments), but the political headwinds (moratoriums) and technology substitution (SMRs) risks are underweighted by bulls.
3. CAT is a cyclical at a cyclical peak. Partially right: revenue is at an all-time high, margins are expanding, and the backlog is at a record. This is textbook peak-cycle presentation. The counter: the backlog provides 2 to 4 years of visibility, which is atypical for a cyclical.
The market is roughly 60% right and 40% wrong. The demand is real but the valuation already discounts the best-case outcome. The pricing error is in the multiple, not the earnings.
Reflexivity Map:
Downward loop: If the stock falls 30% (to ~$600), buyback yield improves modestly, but: (a) SBC becomes less attractive for employee retention, (b) Cat Financial’s implied credit quality perception deteriorates (higher funding costs), (c) customers may defer purchases if they perceive Caterpillar is under stress. Reflexivity multiplier: moderate. A 10% price decline probably causes 2 to 3% earnings impairment through indirect channels.
Upward loop: At $855+, Caterpillar can use its stock as acquisition currency, attract talent via SBC, and Cat Financial benefits from perceived stability (lower funding costs). The reflexivity is positive here but already reflected in the current price.
The Second-Level Question: What if data-centre power demand is real but Caterpillar captures a declining share? Competitors (Cummins, Wärtsilä, Rolls-Royce Power Systems) are also investing in large-engine capacity. If competitive entry compresses power-generation margins by 300bps over 3 years, Power & Energy segment profits fall by roughly $800M annually, or ~$1.30 per share. This scenario is not in the consensus model.
9. THE BEAR CASE
Runway Analysis: If FCF goes to zero, Caterpillar can operate for approximately 18 to 20 months using $6.7B cash plus estimated undrawn revolver capacity of ~$6 to $8B (based on disclosed credit facilities). Not existential, but tight for a company with $12.6B in near-term maturities.
Operating Leverage: The largest semi-fixed cost line is manufacturing labour and overhead (~45% of COGS). Operating leverage: approximately 2.5x (a 10% revenue decline produces a ~25% EBIT decline). This is moderate for an industrial, but combined with the $44B debt load, the downside is amplified.
Short-Seller Thesis: A professional short seller would short CAT because: the stock trades at 37x trailing earnings (102% above its 10-year median P/E of 18.5x) during a cyclical earnings peak, while the company’s growth story depends on a single thematic driver (data-centre power) that faces escalating political opposition (75 projects blocked, moratoriums in multiple states). The trigger: hyperscaler capex guidance cuts or a construction recession. Downside target: $450 to $500 (22 to 24x normalised earnings of ~$21).
Institutional Audit: Caterpillar operates primarily in the US (50%+ of construction revenue), with significant exposure to Latin America, Middle East, and Asia-Pacific. Institutional risk is low in core markets. China exposure is declining (CAT has been diversifying away). Score: 8/10.
Front Page Test: “Data Centre Moratoriums Spread to Texas: Caterpillar’s $72B Backlog Under Threat.” Impact: 15 to 25% stock price decline over a 3-month media cycle, as the market re-prices the backlog conversion rate. Probability: 15 to 20% within 12 months.
10. THE BULL CASE AND ANTIFRAGILITY
TAM Realism: The global data-centre power generation market is estimated at $50 to $80B annually by 2030 (McKinsey estimates up to $7 trillion total investment). Even if CAT captures just 10 to 15% of the power-generation equipment spend, this implies $5 to $12B in incremental annual revenue. This is plausible given CAT’s installed base and dealer network. The risk is not TAM size but TAM timing and capture rate.
Lindy Effect: Founded 1925. Age: 101 years. Lindy expected remaining life: 50 to 101 years. This is a multi-generational franchise. The core equipment business is not going away. The question is purely one of valuation.
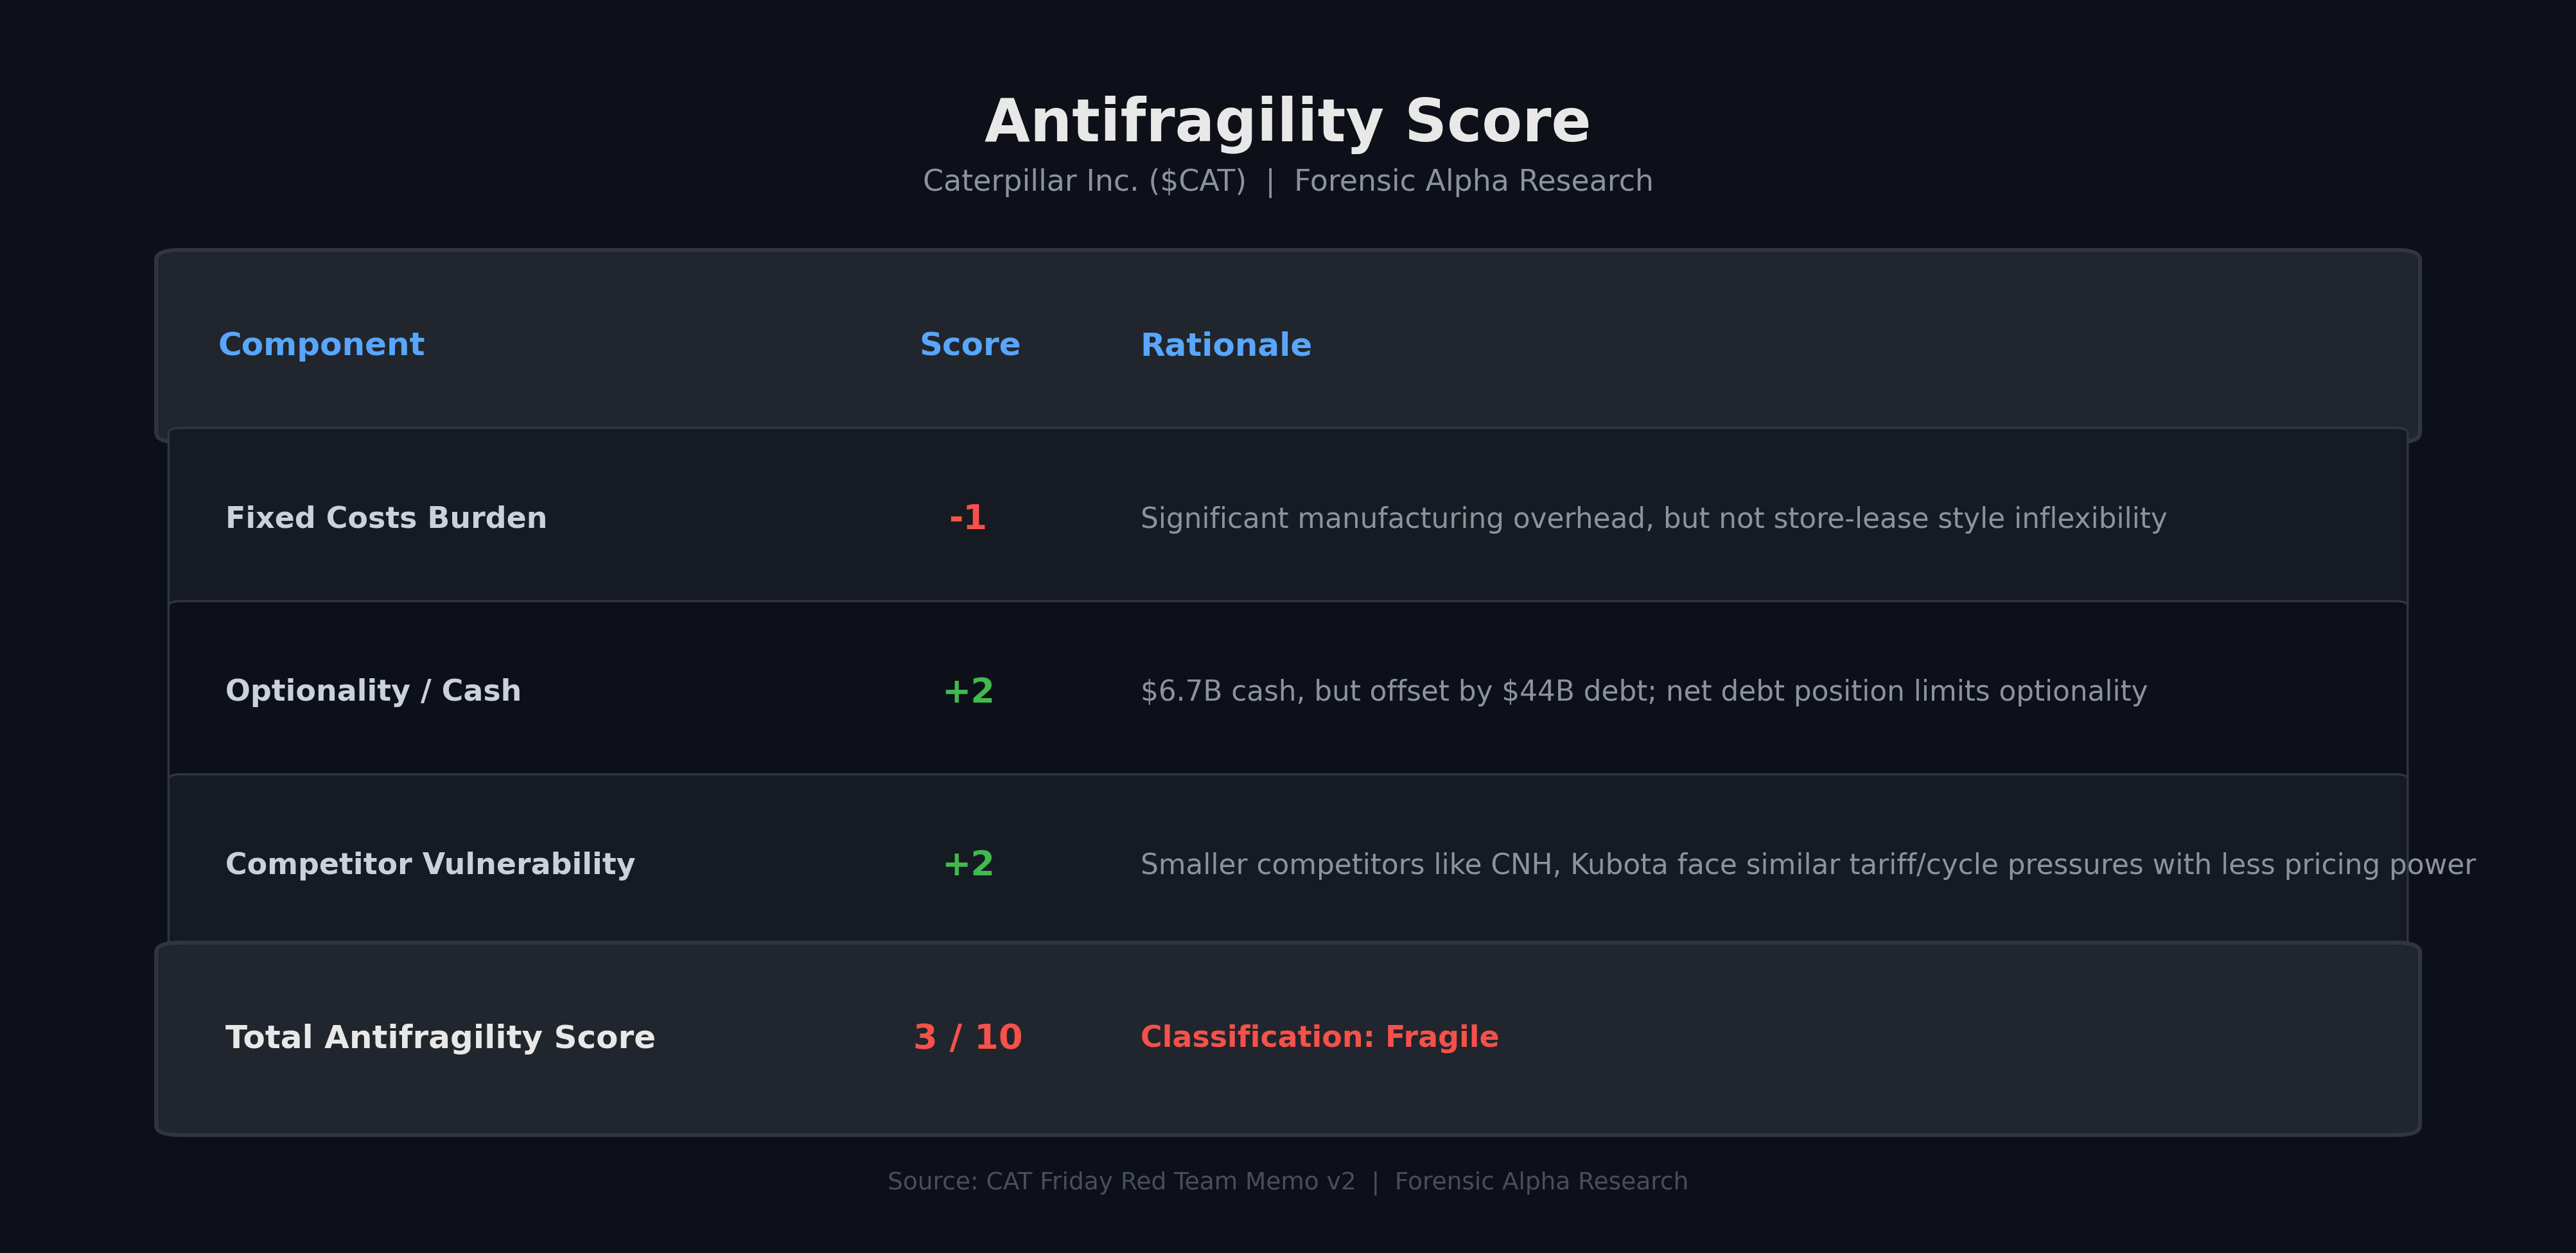
• Fixed Costs Burden: -1 (significant manufacturing overhead, but not store-lease style inflexibility)
• Optionality / Cash: +2 ($6.7B cash, but offset by $44B debt; net debt position limits optionality)
• Competitor Vulnerability: +2 (smaller competitors like CNH, Kubota face similar tariff/cycle pressures with less pricing power)
Antifragility Score: 3/10. Fragile. Caterpillar’s heavy fixed-cost base, significant leverage, and dependence on the capex cycle mean that volatility hurts more than it helps. In a downturn, CAT does not buy distressed competitors; it fights to maintain margins while servicing $44B in debt.
11. VALUATION
Reverse DCF (What the Market Implies at $855):
At $855, with ~462M diluted shares, the market cap is ~$395B. Enterprise value (adding $44B debt, subtracting $6.7B cash) is ~$432B.
To justify $855 per share in a standard DCF (WACC 9%, terminal growth 3%), the market is implying:
• 5-year EPS CAGR of 12 to 15% (from normalised $21 base)
• Terminal FCF growth of 4 to 5% (well above GDP)
• ROIC sustained above 18% (versus the current 14.8% and falling)
These are aggressive assumptions for a 101-year-old cyclical industrial. For context, CAT’s 20-year revenue CAGR is approximately 5 to 6%. The market is pricing in a structural growth shift that doubles the historical rate.
Sensitivity Tornado (Dominant Variable Analysis):
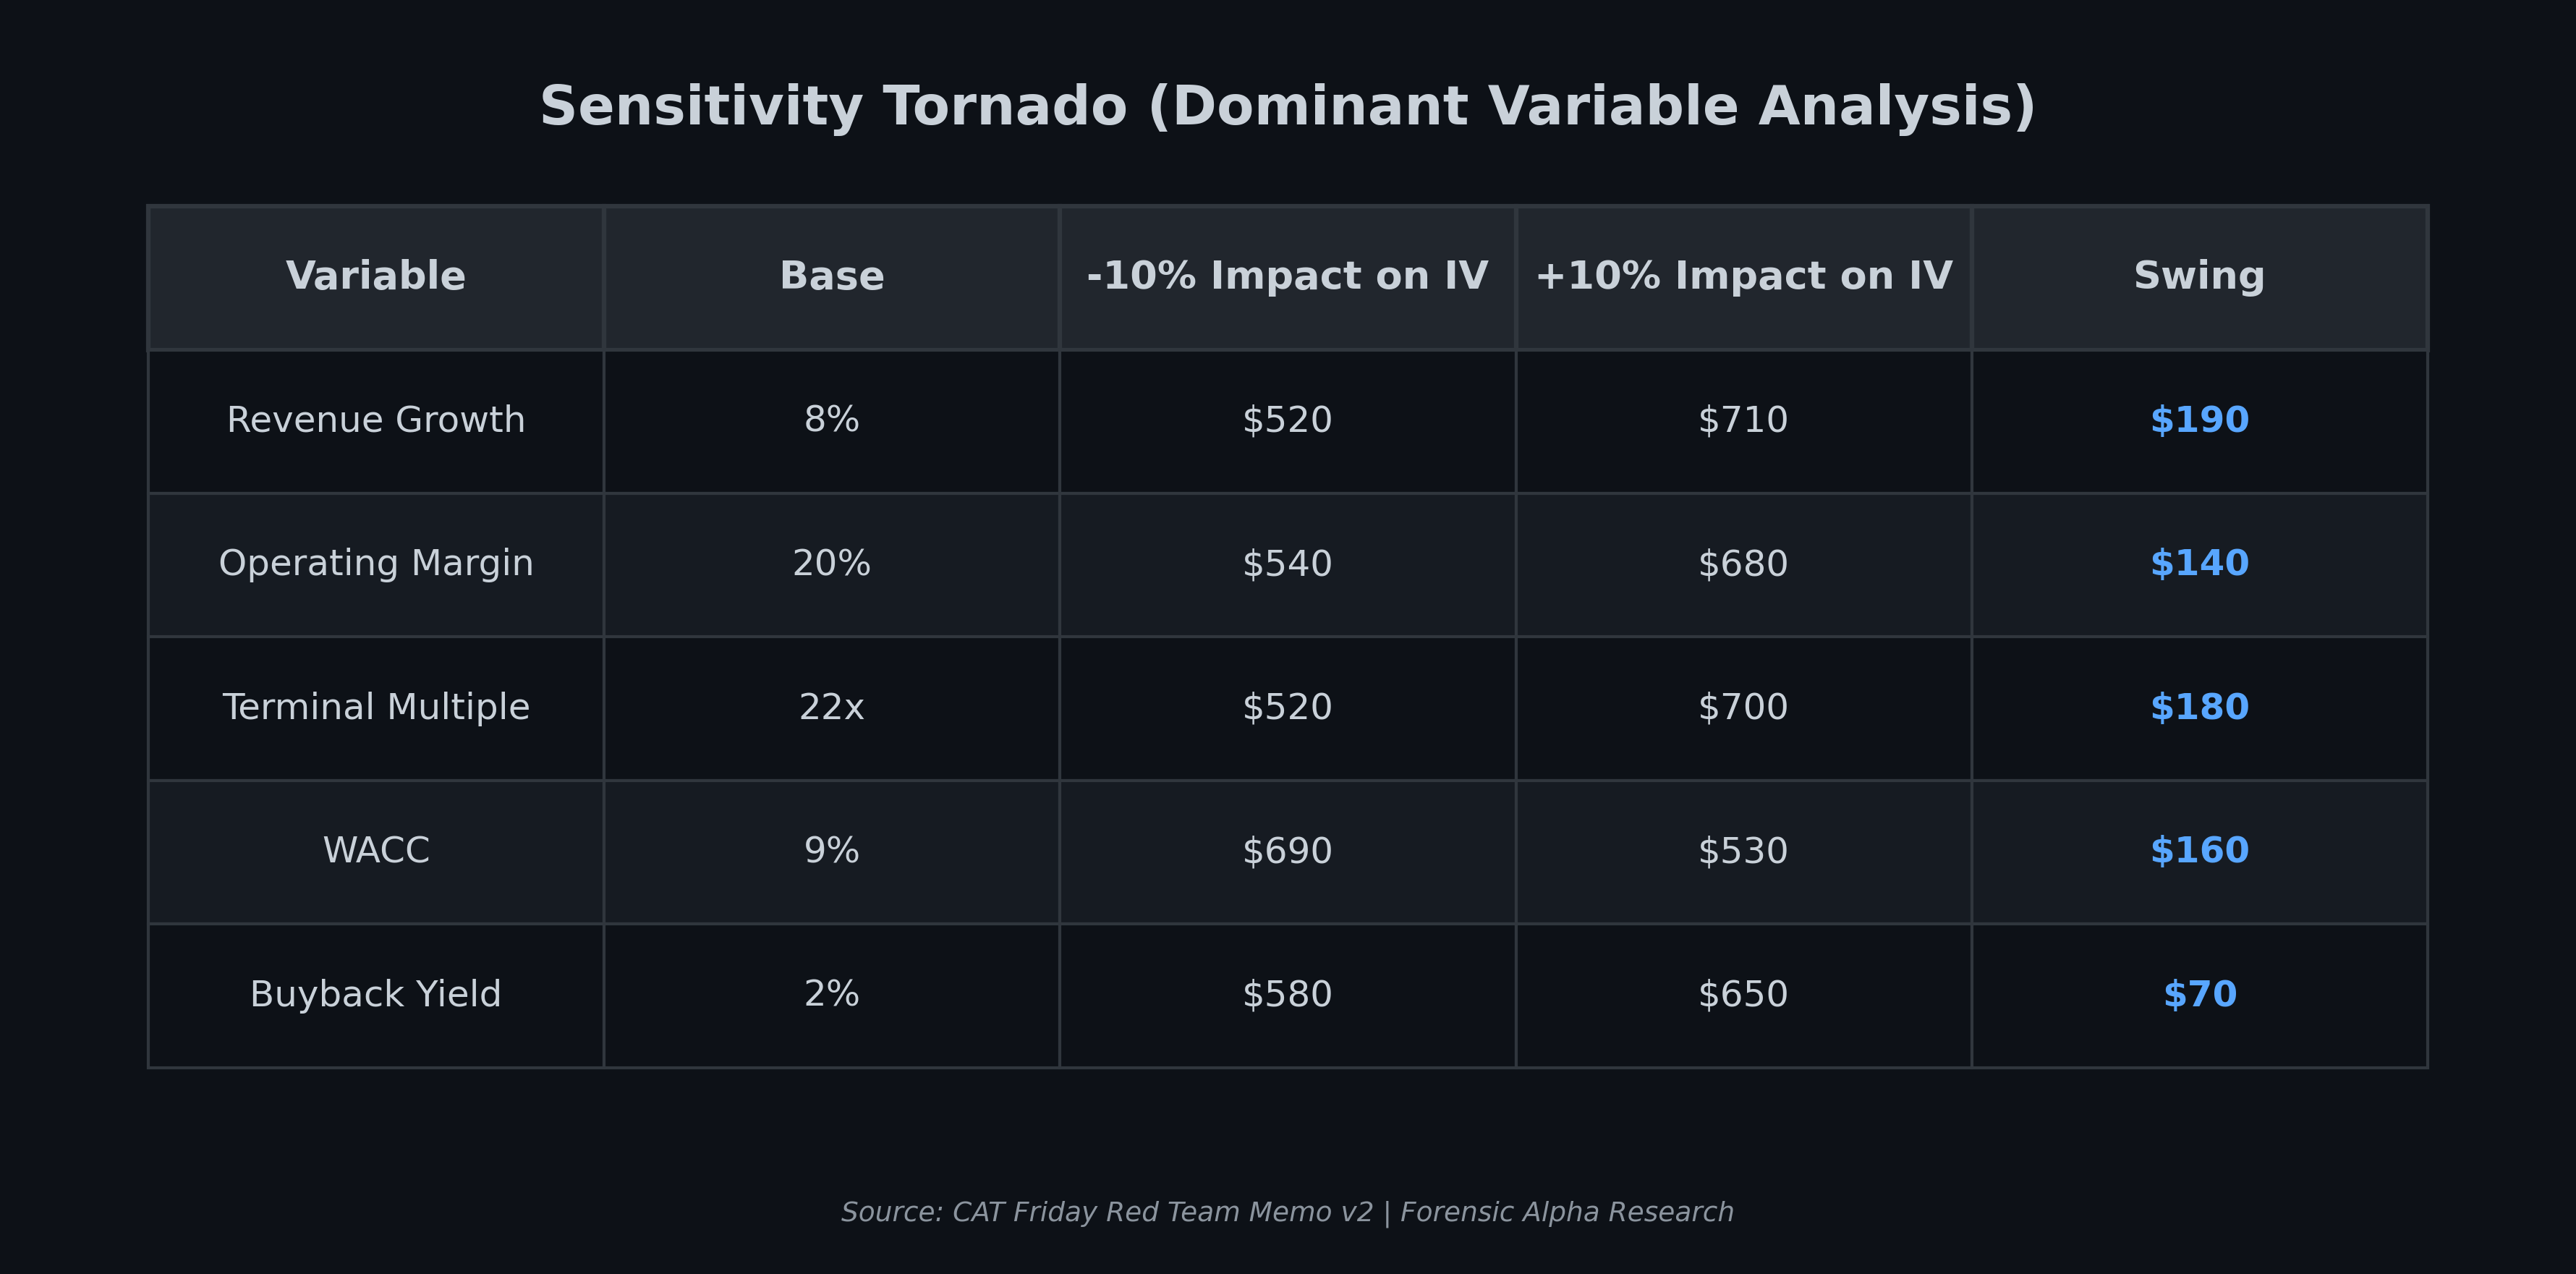
Weights revised (from 25/55/20) to reflect the data-centre moratorium base rate (75 projects worth $130B blocked in Q1 2026 alone). The bear scenario is no longer a tail; it is a live regulatory trajectory.
Margin of Safety: ($623 - $855) / $623 = -37%. The stock trades 37% above our probability-weighted intrinsic value. No margin of safety. Negative margin of safety.
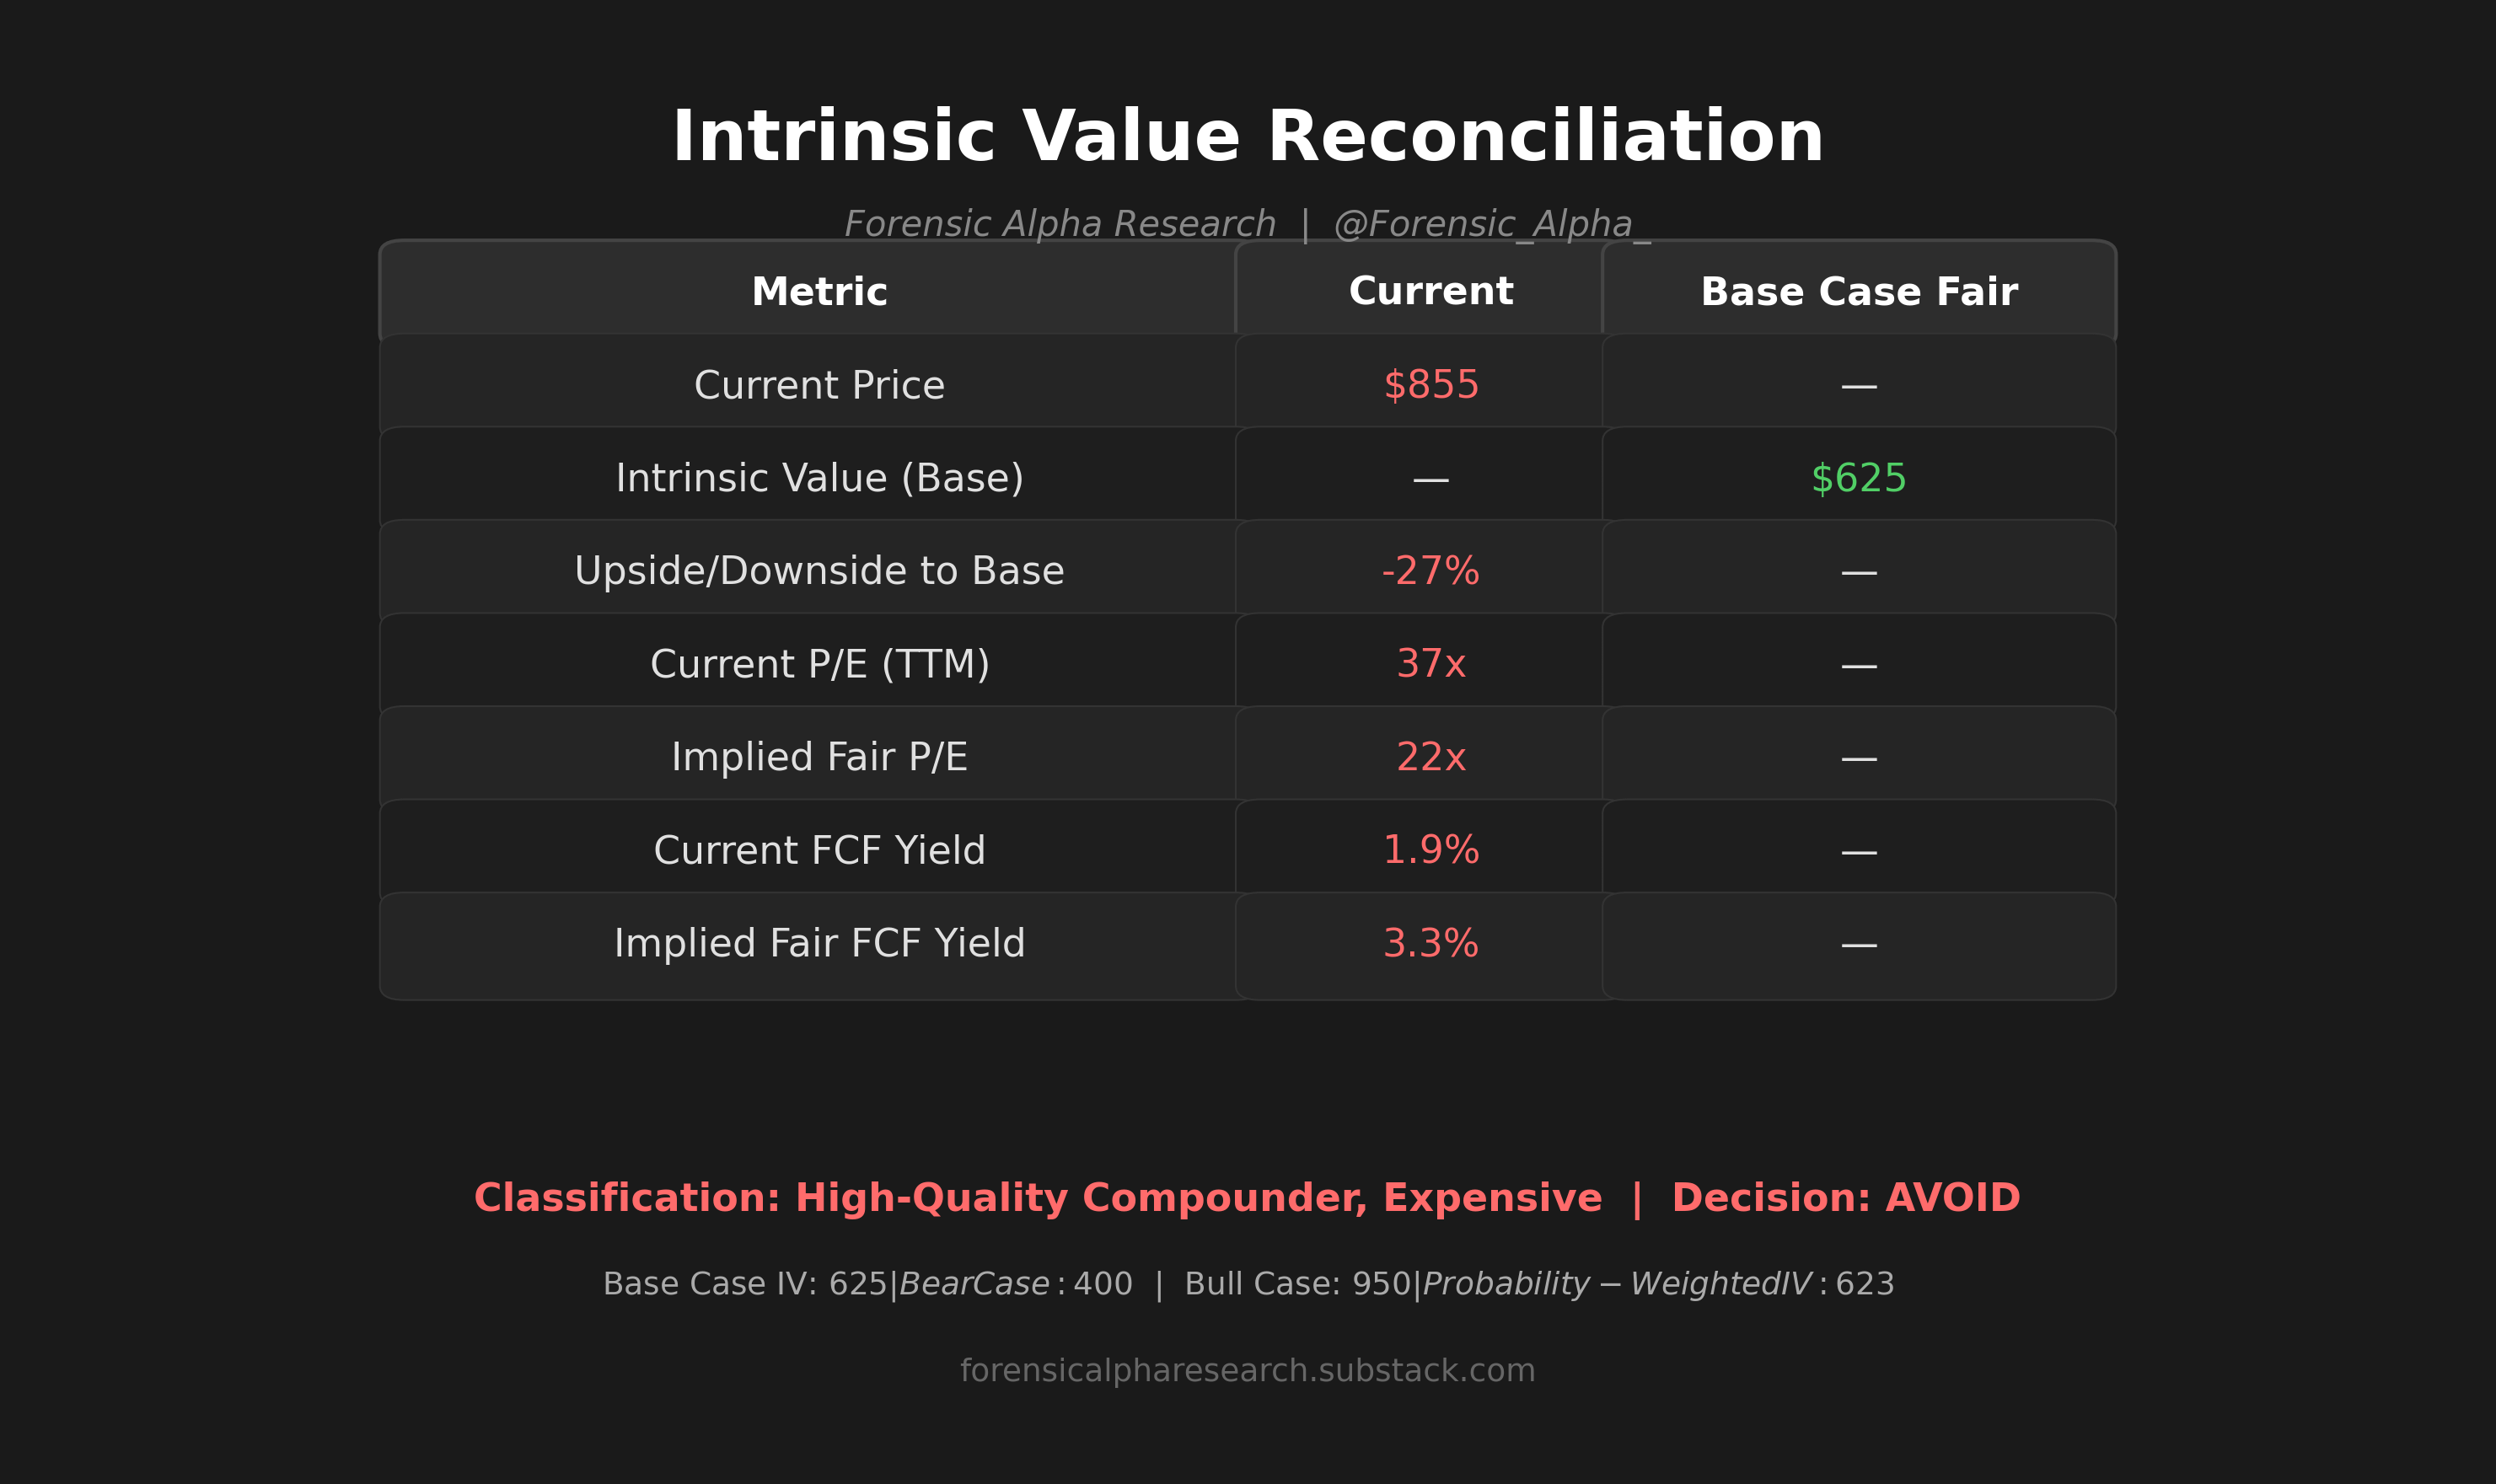
Classification (Mechanical): Current Price ($855) exceeds Base IV ($625) by 37%. Classification: Expensive / Overvalued.
Divergence Flag: Verdict: Great business, terrible price. The qualitative quality (High moat durability, strong management, genuine demand) is contradicted by quantitative valuation (37x trailing, 40% above intrinsic value). The company is a compounder. At $855, it is an expensive compounder priced for a perfection scenario.
12. CATALYSTS AND ACTIVIST UNLOCK
Near-Term Catalysts:
• Q3 2026 earnings (October 27, 2026): another record quarter expected. Already in the price. Probability of positive surprise: 60%. Magnitude: +5 to +10% if beat.
• Trade policy resolution: if tariffs decline, margins expand immediately. Probability: 25% within 12 months.
• Data-centre moratorium spread: if Texas or Virginia impose restrictions, negative catalyst. Probability: 15 to 20%.
Catalyst Dependency Chain: Sustained stock price requires: (1) hyperscaler capex confirmation AND (2) no moratorium spread AND (3) no recession. These are AND gates, not OR gates. All three must hold.
Activist Unlock Plan (Forced Exercise):
1. Suspend buybacks at current valuations. Deploy $5 to $7B annual capital toward accelerated debt reduction (pay down $12.6B near-term maturities without refinancing at higher rates).
2. Spin off Cat Financial as a standalone entity. The captive-finance subsidiary suppresses the parent’s ROIC and adds perceived leverage. A spin-off would crystallise its value ($8 to $10B market cap) and simplify the parent’s balance sheet.
3. Impose valuation discipline on buybacks. Implement a written policy: buybacks only below 20x normalised trailing earnings. Return excess cash via special dividends above that threshold.
4. Accelerate autonomy. Cat’s autonomous mining fleet (Cat Command) is the most commercially advanced in the industry. Ring-fence this as a distinct reporting segment to surface its growth-tech valuation.
5. Cut $500M in SG&A by rationalising overlapping regional operations post-COVID.
Estimated uplift: $50 to $80 per share, or roughly 8 to 13% from current levels. Not a material activist opportunity because the company is already reasonably well-run. The main value-destructive activity is buybacks at peak valuations.
13. PRE-MORTEM AND TAIL RISKS
Pre-Mortem Narrative (Assuming Failure): “We bought CAT at $855 in August 2026. Within 18 months, three things happened simultaneously: hyperscaler capex growth decelerated to mid-single digits as AI model-training cost curves flattened; data-centre moratoriums spread from fringe states to Texas, Virginia, and Ohio, freezing roughly $30 billion of backlog; and a mild US construction recession reduced CI segment revenue by 15%. Earnings fell from $27 (annualised H1 2026) to $18. The multiple compressed from 37x to 20x. The stock bottomed at $360. Cat Financial past-dues spiked to 2.8%, requiring a $500M provision increase. Total loss: 58%.”
False Dawn Indicators (Traps That Look Like Buy Signals):
1. Q3 2026 EPS beats by 10%. This is the backlog converting, not new demand. The backlog conversion rate is a lagging indicator, not a leading one.
2. Tariff costs come in below $2.2B estimate. This is a political variable, not an operational improvement. It could reverse the following quarter.
3. One hyperscaler announces a mega-project using Cat equipment. Single orders do not validate a multi-year cycle. The question is aggregate demand trajectory, not individual deal flow.
Sudden Death Scenario: If small modular reactors (SMRs) reach commercial deployment by 2030 (probability: 10 to 15%) and data centres switch to on-site nuclear power, Caterpillar’s gas-turbine and reciprocating-engine demand from data centres falls 40 to 60% over 3 years. Residual value: the traditional construction/mining business, worth roughly $350 to $450 per share. The data-centre premium evaporates entirely. Non-linear existential risk: Low to Medium (10 to 15% probability).
Kill Conditions:
• If adjusted EPS falls below $20 for two consecutive quarters: reduce exposure by 50%.
• If backlog declines more than 10% quarter-over-quarter: exit entirely.
• If Cat Financial past-dues exceed 2.5%: exit entirely.
• If data-centre moratoriums spread to 3+ Tier 1 states (TX, VA, OH, NC, GA): exit entirely.
Zeckhauser Uncertainty Taxonomy:
• Known Knowns: Tariff costs (~$2.2B), current backlog ($72B), rate environment (10Y at ~4.6%).
• Known Unknowns: Hyperscaler capex trajectory post-2027, moratorium spread rate, competitive entry in large engines (Cummins, Wärtsilä).
• Unknown Unknowns: Technology substitution (SMRs, advanced batteries), geopolitical disruption to global supply chains, Black Swan credit event in Cat Financial’s portfolio.
Position sizing is constrained by Known Unknowns and Unknown Unknowns. Even if the thesis were bullish, the Kelly-optimal position would be small given the variance of outcomes.
14. FINAL SYNTHESIS AND DECISION
Classification: High-Quality Compounder. Expensive.
Decision: Avoid.
1-Sentence Thesis: Caterpillar is a 101-year-old, high-moat industrial franchise experiencing a genuine but likely cyclical demand surge, priced at 37x trailing earnings (102% above its 10-year median multiple), offering negative margin of safety against a base-case intrinsic value of $625 and severe downside ($400) if the data-centre thesis peaks.
“If I am wrong, it will be because…” the data-centre power cycle is truly structural (not cyclical), moratoriums are contained, and Caterpillar successfully transitions from a cyclical industrial to a secular infrastructure compounder, justifying a permanent re-rating to 30x+ normalised earnings. This requires AI infrastructure investment to compound at 15%+ for a decade with no political or technological disruption. We assign this 20% probability.
Regret Matrix:
• We will regret avoiding if: (1) H2 2026 revenue exceeds $42B (annualised $84B+); (2) Data-centre moratoriums are overturned or pre-empted by federal legislation; (3) CAT announces a transformative acquisition (autonomy, SMR technology).
• We will regret buying if: (1) Hyperscaler capex guidance is cut >15% in any single quarter; (2) US non-residential construction starts fall 10%+; (3) Cat Financial past-dues exceed 2.0%.
Opportunity Cost: At 37x trailing earnings and a 1.9% FCF yield, CAT offers inferior risk-adjusted returns versus:
• The S&P 500 at ~22x forward (Shiller P/E ~36): comparable risk, lower valuation
• 10-year Treasury at 4.6%: risk-free alternative with higher current yield than CAT’s FCF yield
• Deere & Company (DE) at ~33x trailing with stronger aftermarket recurring revenue
Decision: Avoid at $855. Upgrade to Hold at $600 (22x normalised EPS). Upgrade to Buy at $480 (18x normalised EPS, 25%+ margin of safety to base case).
13C: MACHINE-READABLE EXECUTIVE SUMMARY
{
"ticker": "CAT",
"company": "Caterpillar Inc.",
"analysis_date": "2026-08-15",
"current_price_usd": 855,
"intrinsic_value_base_usd": 625,
"intrinsic_value_bear_usd": 400,
"intrinsic_value_bull_usd": 950,
"probability_weighted_iv_usd": 623,
"scenario_weights": {"bear": 0.30, "base": 0.50, "bull": 0.20},
"upside_to_base_pct": -26.9,
"margin_of_safety_pct": -37.1,
"normalised_eps_usd": 21.18,
"trailing_eps_usd": 23.25,
"forward_eps_consensus_usd": 28.80,
"pe_trailing": 36.8,
"pe_normalised": 40.4,
"pe_forward": 29.7,
"pe_10yr_median": 18.5,
"revenue_ttm_usd_B": 74.7,
"revenue_fy2025_usd_B": 67.6,
"fcf_yield_pct": 1.9,
"dividend_yield_pct": 0.76,
"roic_2025_pct": 14.8,
"total_debt_usd_B": 44.1,
"debt_to_equity_pct": 232.8,
"backlog_usd_B": 72.1,
"fy2025_incremental_margin_pct": -69,
"q2_2026_incremental_margin_pct": 48,
"moat_type": ["switching_costs", "distribution_network", "brand", "captive_finance"],
"moat_durability": "High",
"antifragility_score": 3,
"antifragility_class": "Fragile",
"classification": "High-Quality Compounder, Expensive",
"decision": "Avoid",
"position_size_kelly_pct": 0,
"buy_zone_usd": "below 480",
"hold_zone_usd": "480-650",
"avoid_zone_usd": "above 650",
"price_target_base_usd": 625,
"catalyst_timeline": "0-12 months",
"dominant_variable": "revenue_growth_sustainability",
"kill_triggers": [
"Adjusted EPS below $20 for 2 consecutive quarters",
"Backlog decline >10% QoQ",
"Cat Financial past-dues >2.5%",
"Data-centre moratoriums in 3+ Tier 1 states"
],
"key_risk": "Cyclical peak valuation with AI-infrastructure concentration risk",
"confidence": "Medium-High"
}
The price you pay determines the return you earn. At $855, the market has already awarded Caterpillar full credit for a supercycle that has barely begun and may face headwinds it has not yet encountered. A great franchise at the wrong price is still the wrong investment.
This is forensic equity analysis for educational purposes. It is not personalised financial advice. The author may hold positions in securities discussed.